Environment
Pimoroni Enviroplus dashboard
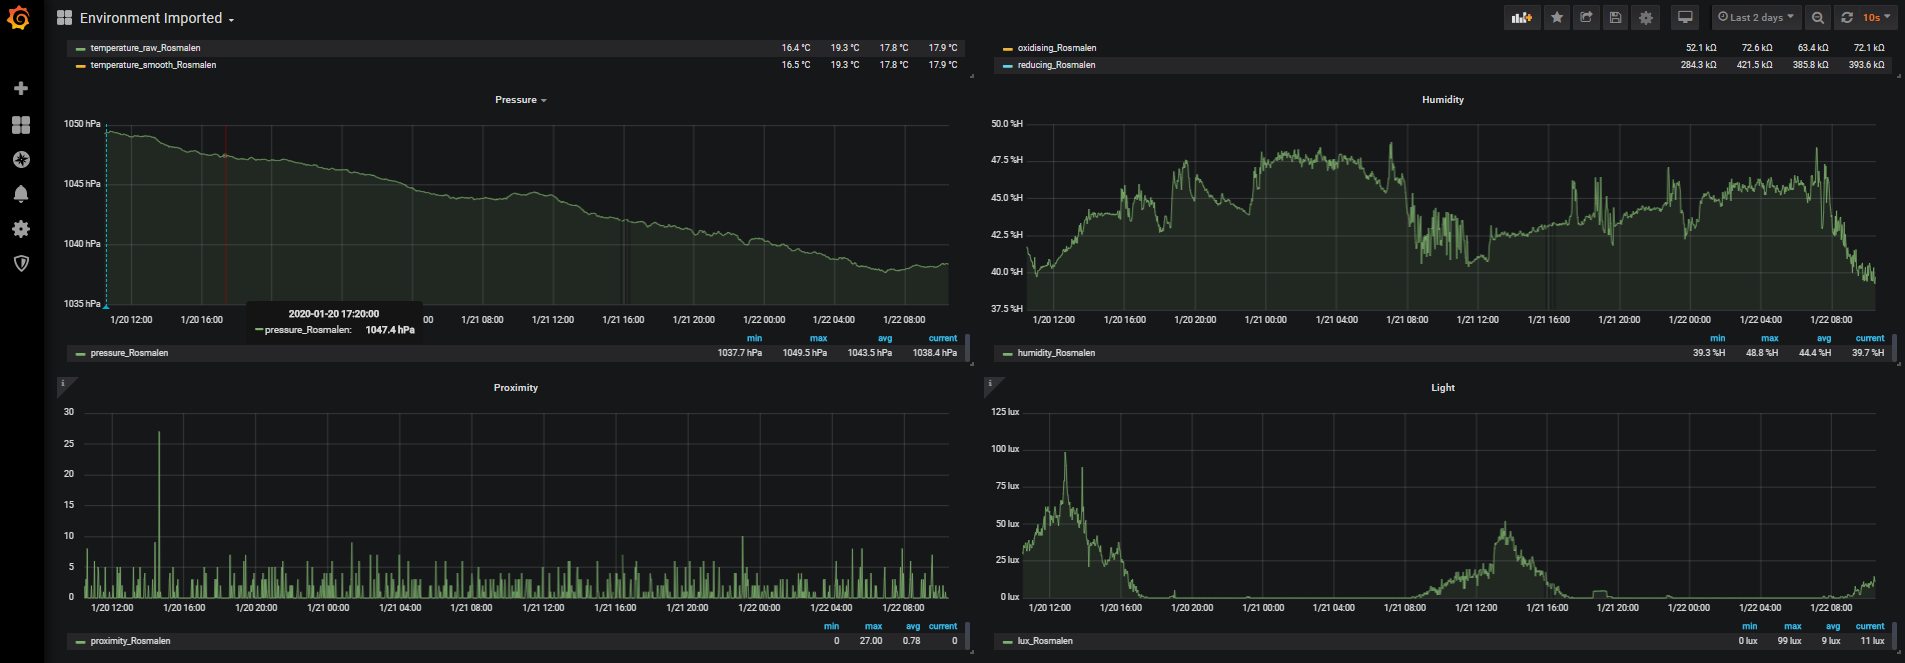
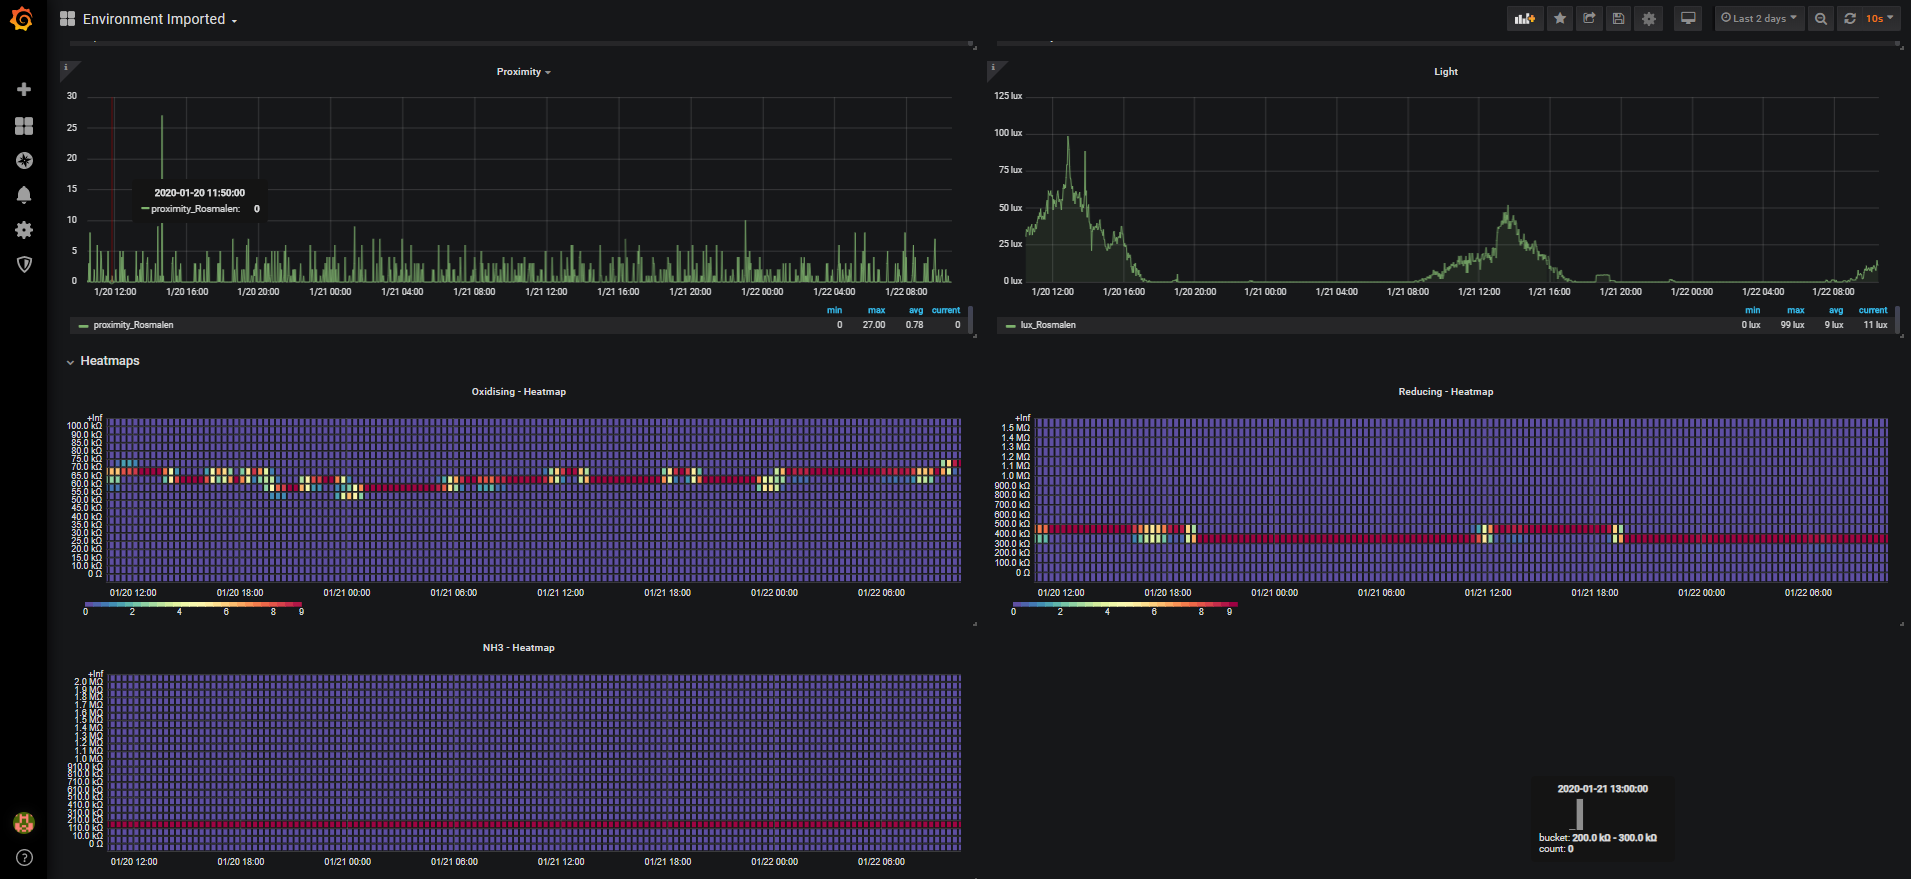
Table of Contents
About The Project
![Product Name Screen Shot][product-screenshot]
Built With
Getting Started
To get the prometheus enviroplus-exporter up and running I'm assuming you already have Prometheus and Grafana running somewhere. Note: I wouldn't recommend running Prometheus on a Raspberry Pi (using a local SD card) as this could drastically reduce the lifetime of the SD card as samples are written quite often to disk.
Prerequisites
To run the enviroplus-exporter you need to have the enviroplus-python library by Pimoroni installed:
One-line (Installs enviroplus-python library from GitHub)
curl -sSL https://get.pimoroni.com/enviroplus | bash
Note Raspbian Lite users may first need to install git: sudo apt install git
Installation
We're going to run the enviroplus-exporter as the user pi in the directory /usr/src/. Adjust this as you wish.
1.Clone the enviroplus-exporter repository
cd
git clone https://github.com/tijmenvandenbrink/enviroplus_exporter.git
sudo cp -r enviroplus_exporter /usr/src/
sudo chown -R pi:pi /usr/src/enviroplus_exporter
2.Install as a Systemd service
cd /usr/src/enviroplus_exporter
sudo cp contrib/enviroplus-exporter.service /etc/systemd/system/enviroplus-exporter.service
sudo chmod 644 /etc/systemd/system/enviroplus-exporter.service
sudo systemctl daemon-reload
3.Start the enviroplus-exporter service
sudo systemctl start enviroplus-exporter
4.Check the status of the service
sudo systemctl status enviroplus-exporter
If the service is running correctly, the output should resemble the following:
pi@raspberrypi:/usr/src/enviroplus_exporter $ sudo systemctl status enviroplus-exporter
● enviroplus-exporter.service - Enviroplus-exporter service
   Loaded: loaded (/etc/systemd/system/enviroplus-exporter.service; disabled; vendor preset: enabled)
   Active: active (running) since Fri 2020-01-17 14:13:41 CET; 5s ago
 Main PID: 30373 (python)
    Tasks: 2 (limit: 4915)
   Memory: 6.0M
   CGroup: /system.slice/enviroplus-exporter.service
           └─30373 /usr/bin/python /usr/src/enviroplus_exporter/enviroplus_exporter.py --bind=0.0.0.0 --port=8000
Jan 17 14:13:41 wall-e systemd[1]: Started Enviroplus-exporter service.
Jan 17 14:13:41 wall-e python[30373]: 2020-01-17 14:13:41.565 INFO     enviroplus_exporter.py - Expose readings from the Enviro+ sensor by Pimoroni in Prometheus format
Jan 17 14:13:41 wall-e python[30373]: Press Ctrl+C to exit!
Jan 17 14:13:41 wall-e python[30373]: 2020-01-17 14:13:41.581 INFO     Listening on http://0.0.0.0:8000
5.Enable at boot time
sudo systemctl enable enviroplus-exporter
Usage
So now we've setup the Prometheus enviroplus-exporter we can start scraping this endpoint from our Prometheus server and get a nice dashboard using Grafana.
Prometheus
If you haven't setup Prometheus yet have a look at the installation guide here.
Below is a simple scraping config:
# Sample config for Prometheus.
global:
scrape_interval: 15s # By default, scrape targets every 15 seconds.
evaluation_interval: 15s # By default, scrape targets every 15 seconds.
scrape_timeout is set to the global default (10s).
Attach these labels to any time series or alerts when communicating with
external systems (federation, remote storage, Alertmanager).
external_labels:
monitor: 'external'
Load and evaluate rules in this file every 'evaluation_interval' seconds.
rule_files:
- "first.rules"
- "second.rules"
A scrape configuration containing exactly one endpoint to scrape:
Here it's Prometheus itself.
scrape_configs:
The job name is added as a label job=<job_name> to any timeseries scraped from this config.
-
job_name: 'prometheus'
Override the global default and scrape targets from this job every 5 seconds.
scrape_interval: 15s
scrape_timeout: 15s
metrics_path defaults to '/metrics'
scheme defaults to 'http'.
static_configs:
- targets: ['localhost:9090']
-
job_name: node
If prometheus-node-exporter is installed, grab stats about the local
machine by default.
static_configs:
- targets: ['localhost:9100']
If environmentplus-exporter is installed, grab stats about the local
machine by default.
-
job_name: environment
static_configs:
-
targets: ['localhost:8000']
labels:
group: 'environment'
location: 'Amsterdam'
-
targets: ['newyork.example.com:8001']
labels:
group: 'environment'
location: 'New York'
I added two labels to the targets group: environment and location: SomeLocation. The Grafana dashboard uses these labels to distinguish the various locations.
Grafana
I will publish a Grafana Dashboard shortly.
Roadmap
See the open issues for a list of proposed features (and known issues).
Contributing
Contributions are what make the open source community such an amazing place to be learn, inspire, and create. Any contributions you make are greatly appreciated.
- Fork the Project
- Create your Feature Branch (
git checkout -b feature/AmazingFeature) - Commit your Changes (
git commit -m 'Add some AmazingFeature') - Push to the Branch (
git push origin feature/AmazingFeature) - Open a Pull Request
License
Distributed under the MIT License. See LICENSE for more information.
Data source config
Collector config:
Upload an updated version of an exported dashboard.json file from Grafana
| Revision | Description | Created | |
|---|---|---|---|
| Download |