NVIDIA GPU metrics dashboard
This dashboard is to display NVIDIA GPU Kubernetes cluster metrics version +1.13
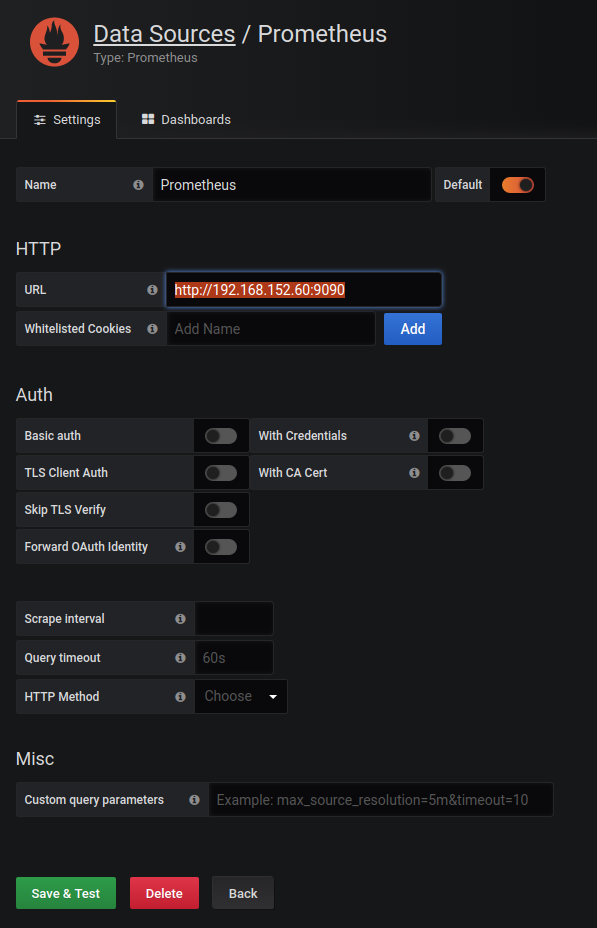
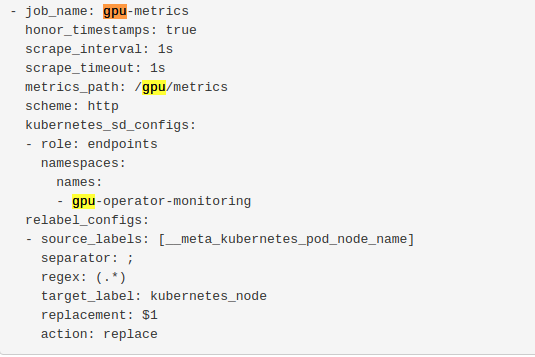
This dashboard displays GPU metrics collected from NVIDIA dcgm-exporter via a metric endpoint added to Prometheus. A separate endpoint is added to Prometheus via a scrape configmap as shown in the screenshot. You will need to update the Prometheus url in the datasource section for Grafana the display metrics. You can find all the steps here
Data source config
Collector config:
Upload an updated version of an exported dashboard.json file from Grafana
| Revision | Description | Created | |
|---|---|---|---|
| Download |


