
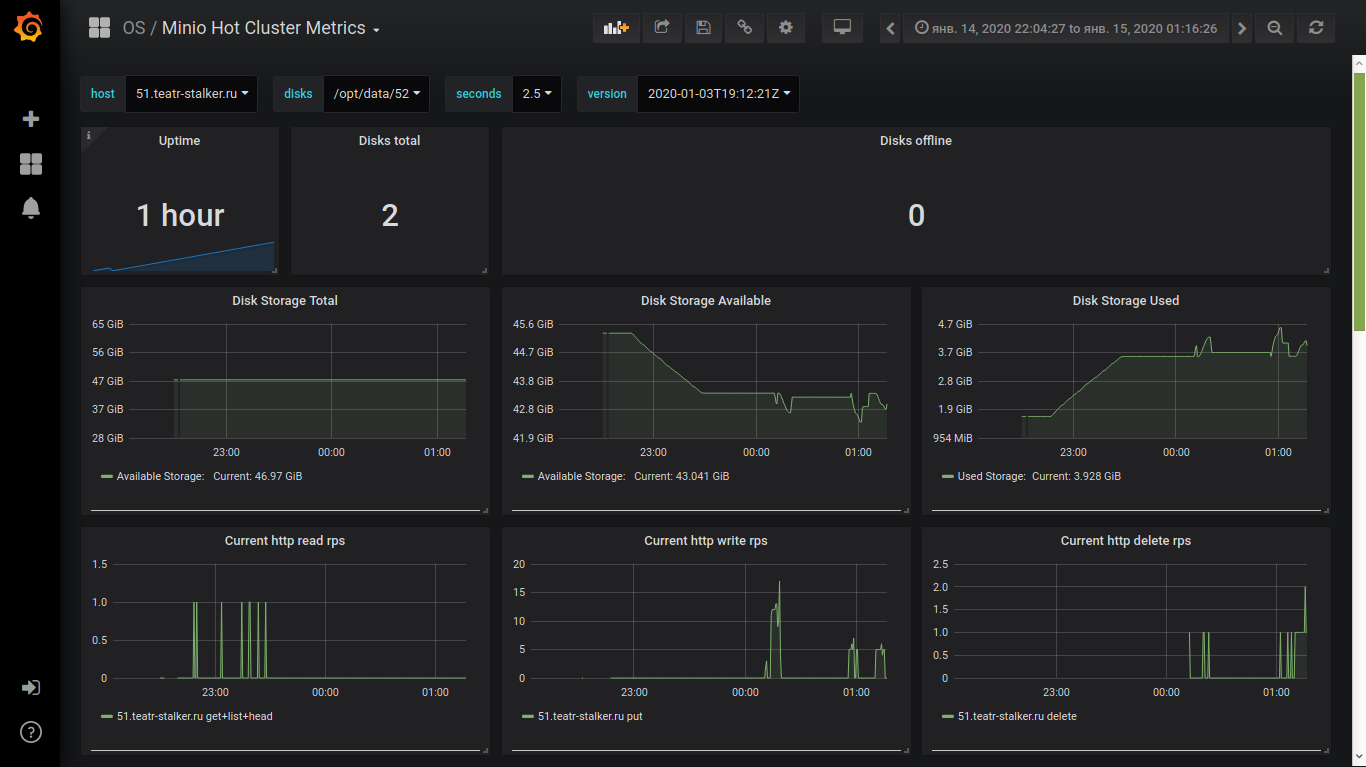
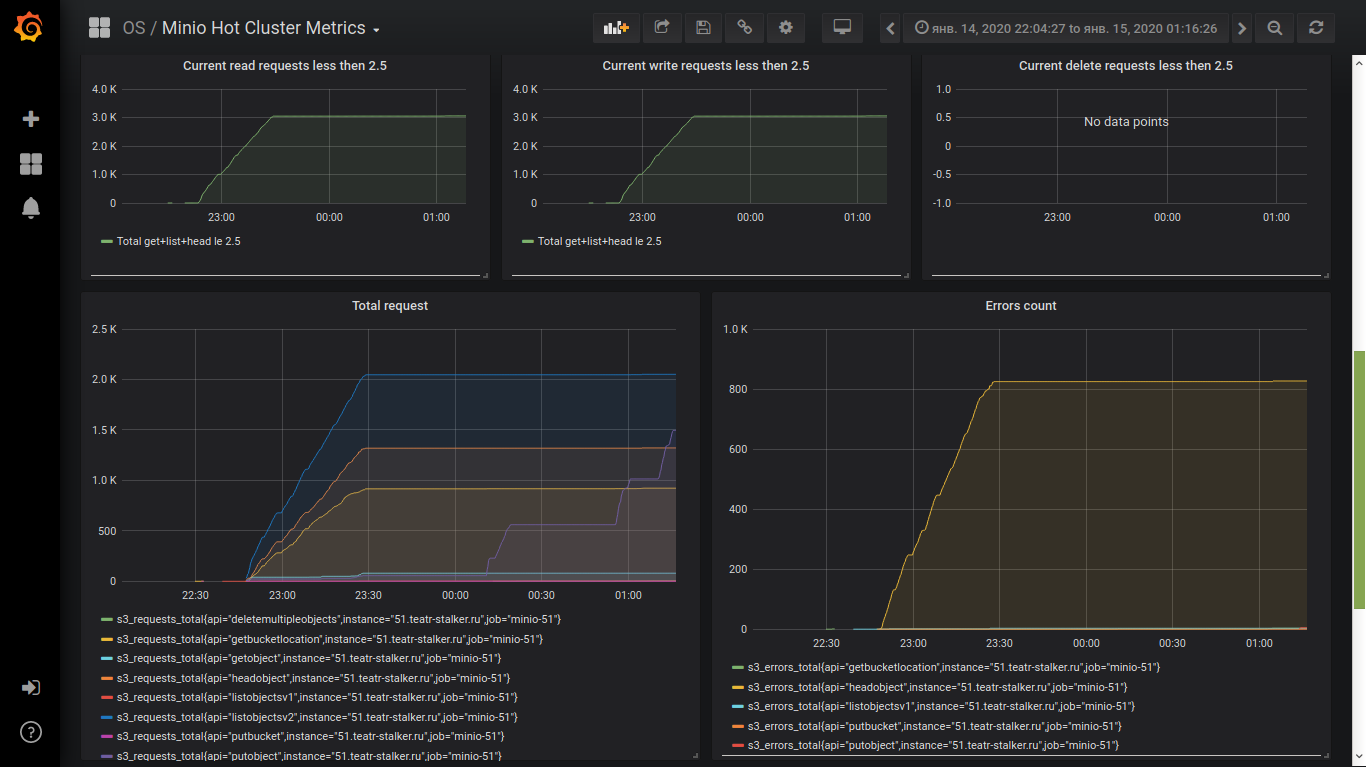
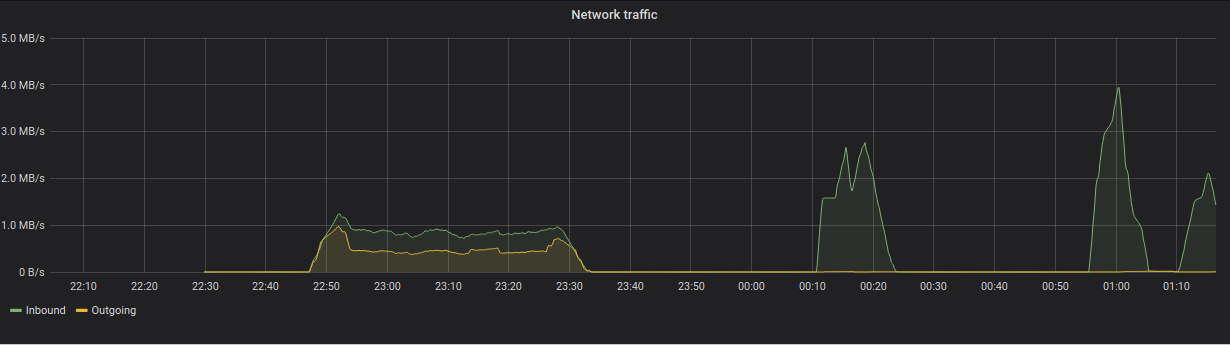
Minio distributed cluster metrics
https://min.io/ is High Performance Object Storage Amazon S3 compatible. This dashboard collect all actual monitoring stats for minio cluster 2020-01-03T20-33-14Z version
First you shroud configure minio monitoring as described in How to monitor MinIO server with Prometheus
Then import this dashboard
Data source config
Collector type:
Collector plugins:
Collector config:
Revisions
Upload an updated version of an exported dashboard.json file from Grafana
| Revision | Description | Created | |
|---|---|---|---|
| Download |
MinIO
Easily monitor Minio, a Kubernetes-native high-performance object storage server, with Grafana Cloud's out-of-the-box monitoring solution.
Learn more