Infra, services monitoring with Metricbeat
Metricbeat, Elasticsearch base to monitor server's infra and services activities
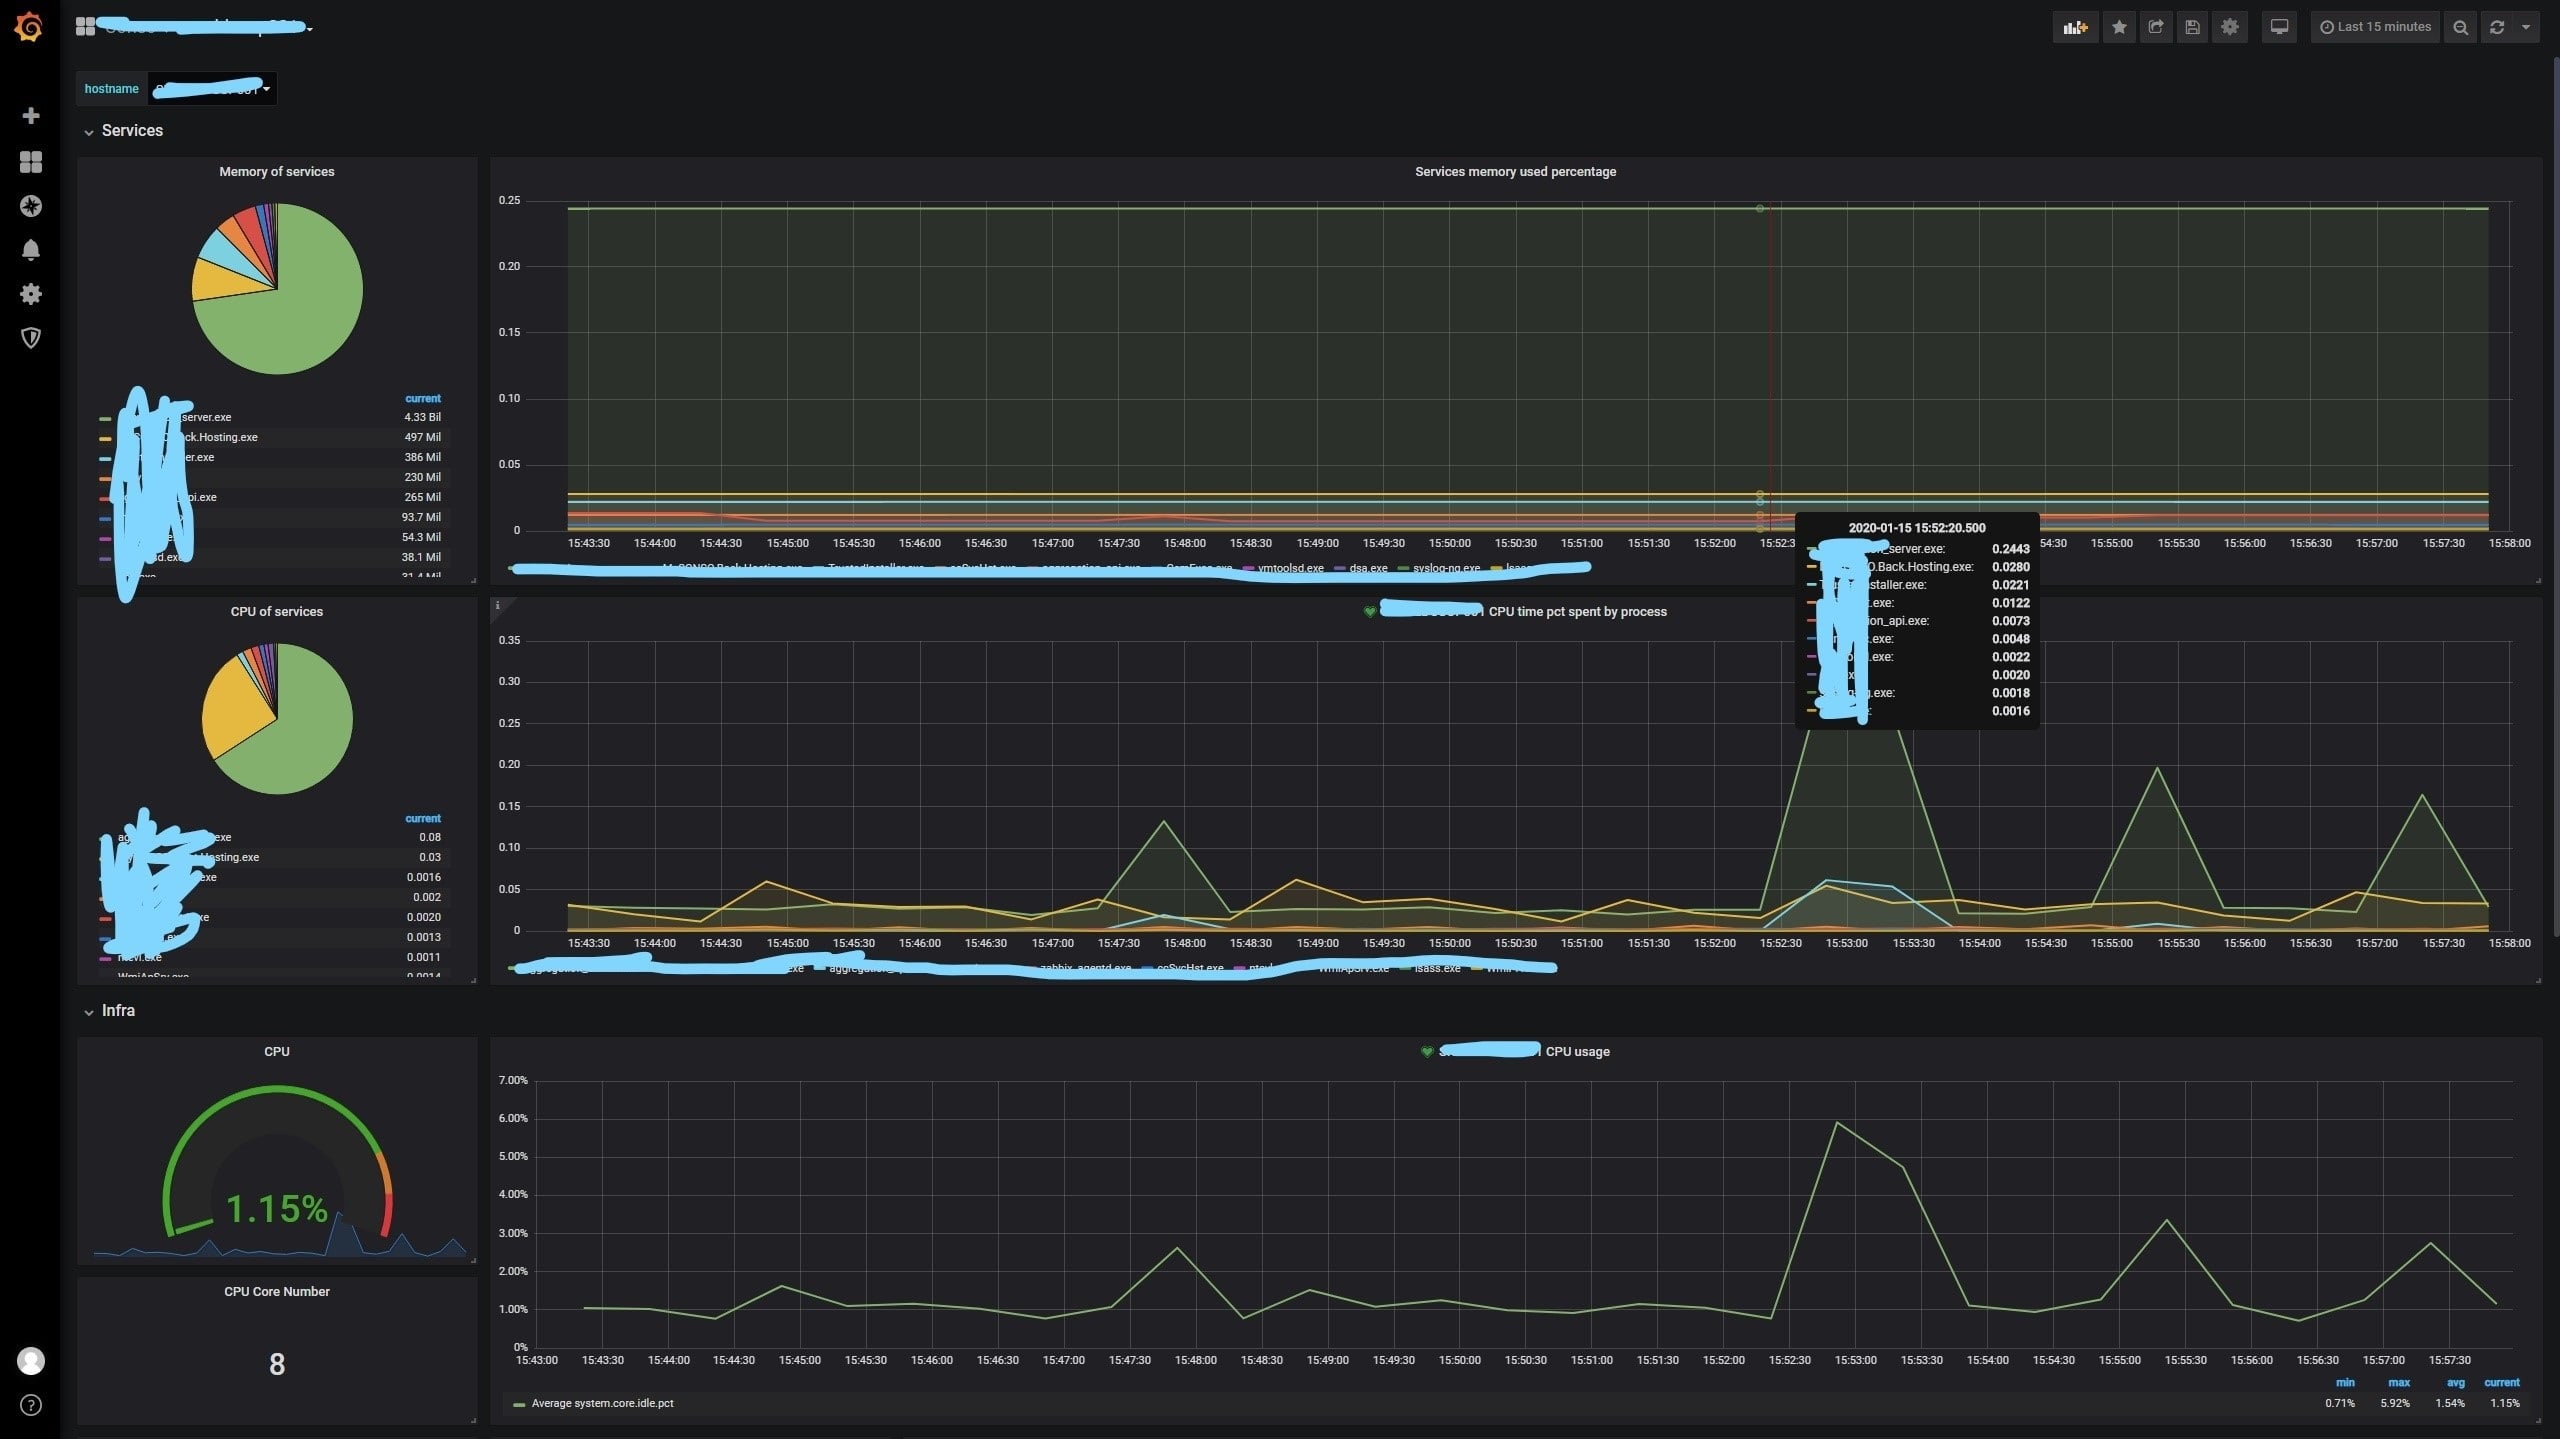
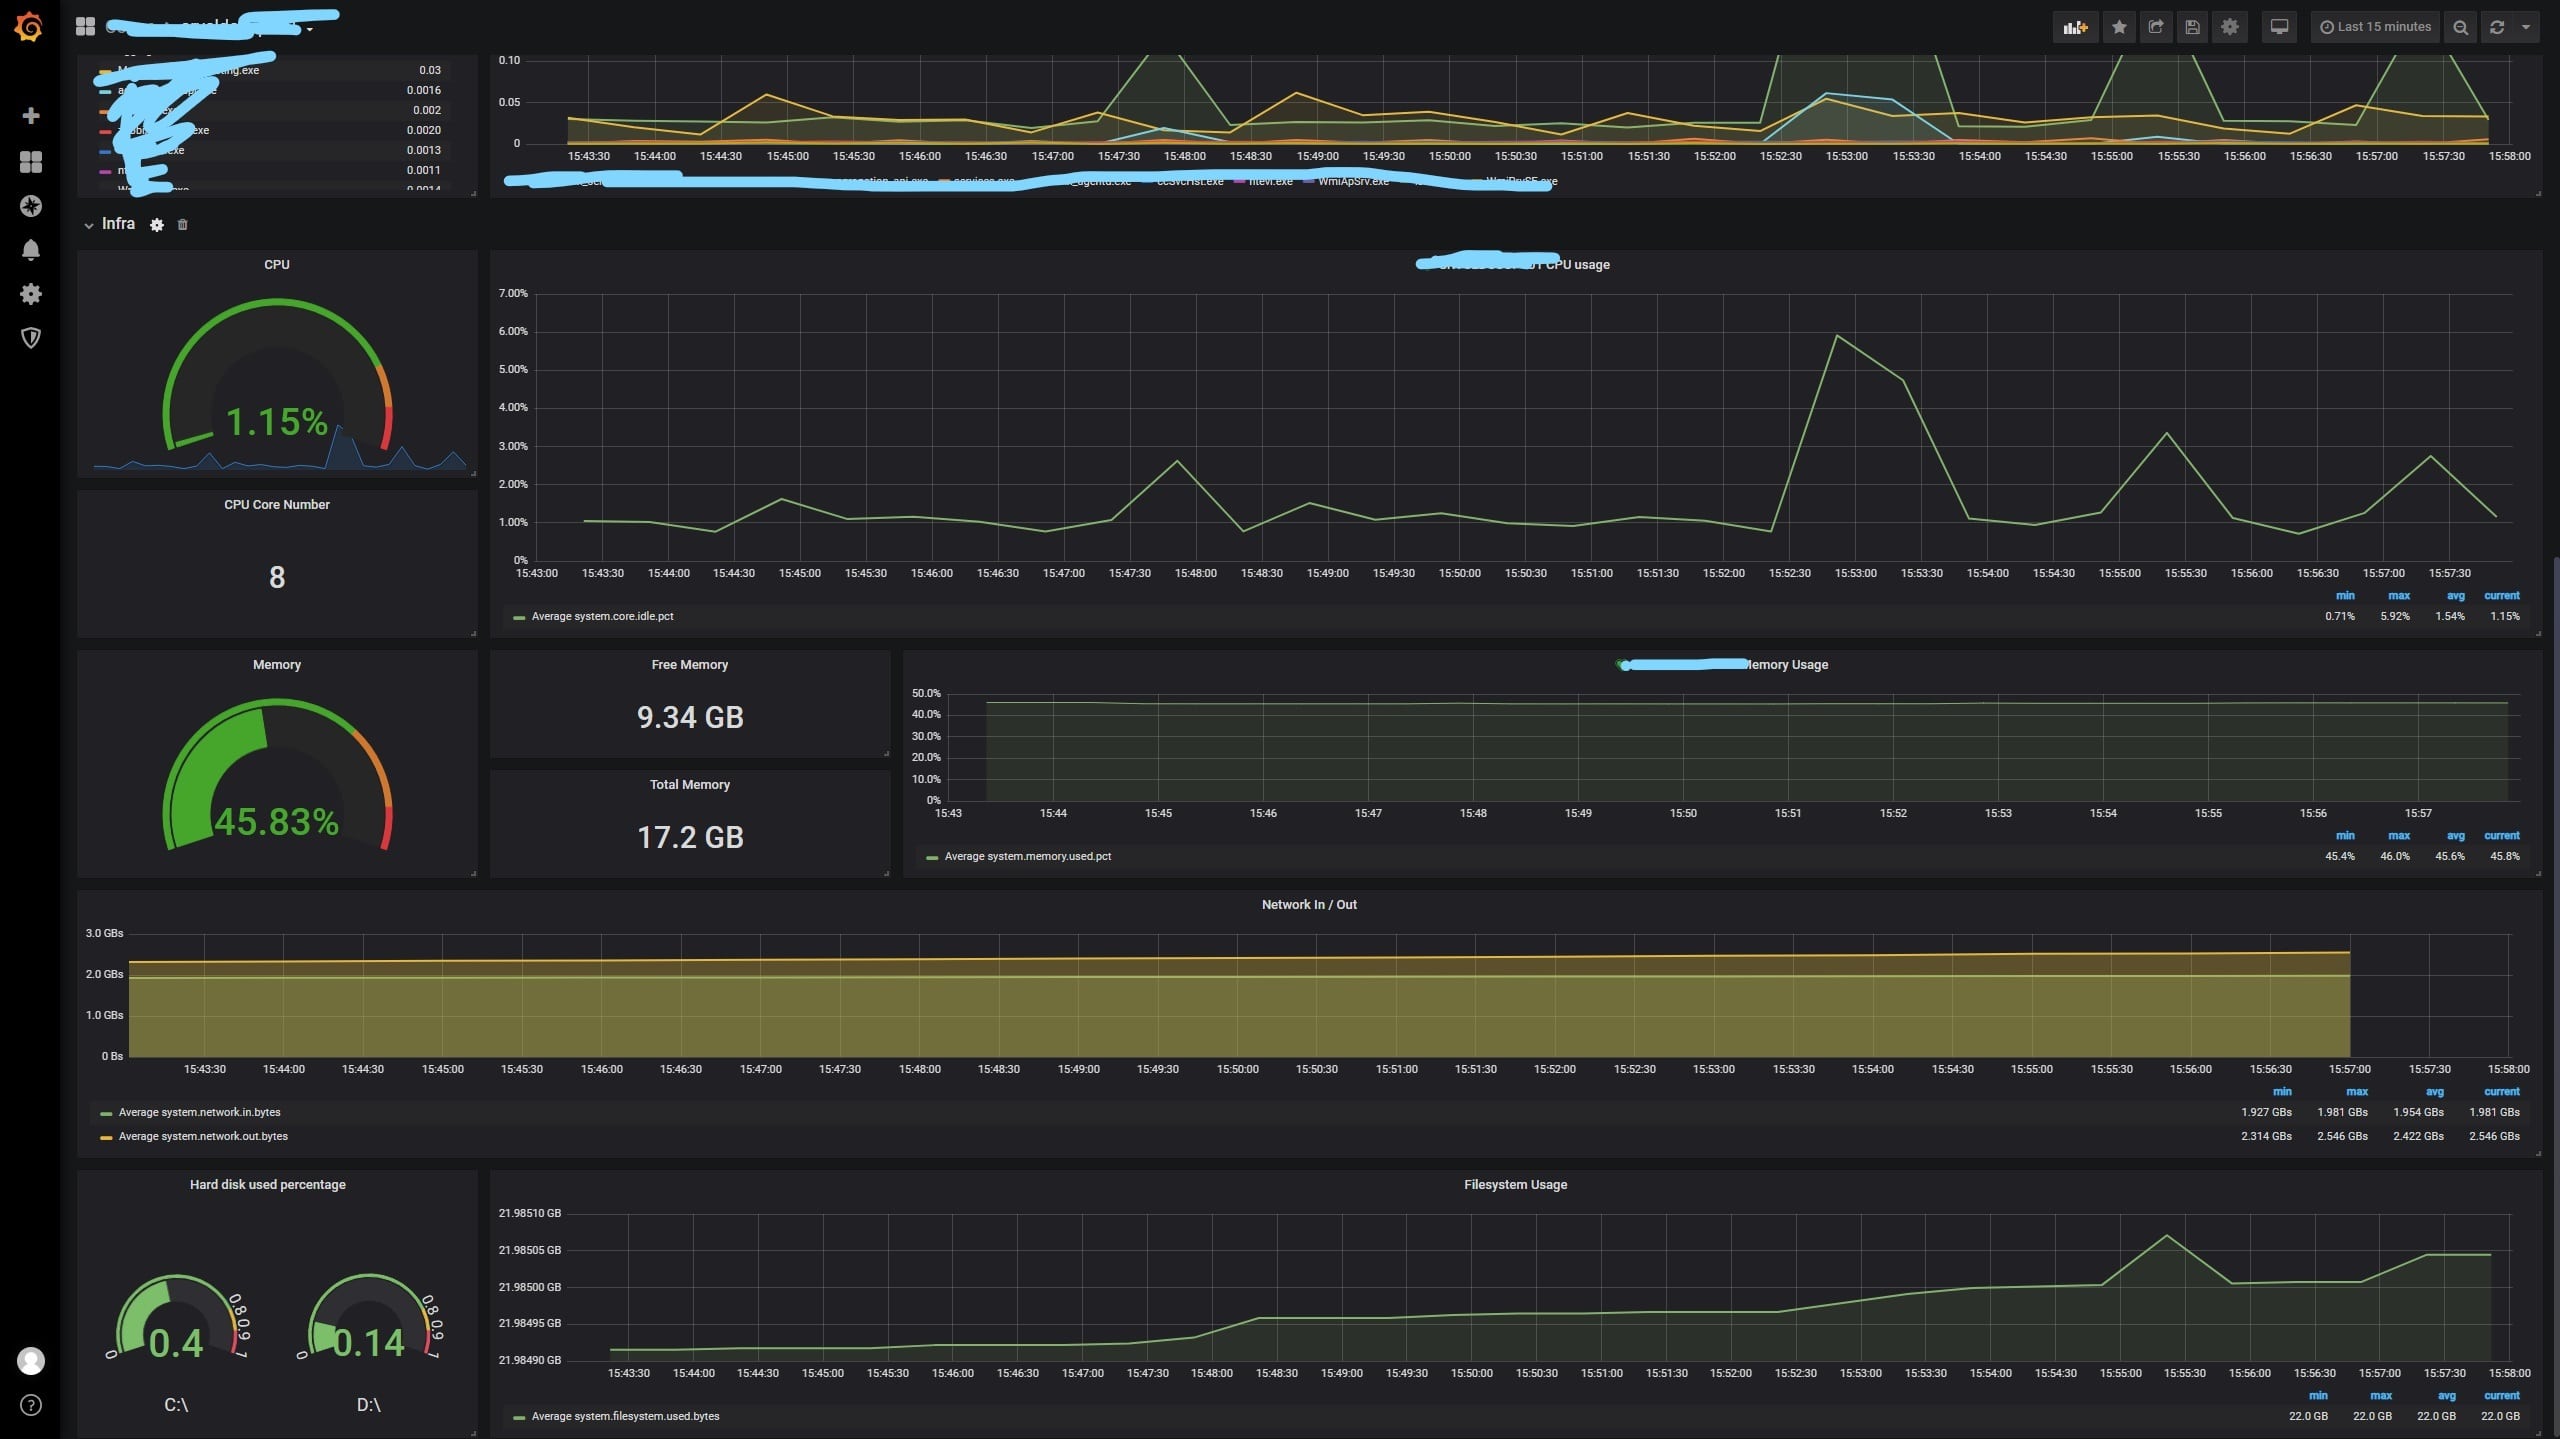
Monitor your server's infra and services in 10 minutes !!
- Install metricbeat in your host server and feed Elasticsearch base (https://www.elastic.co/guide/en/beats/metricbeat/current/metricbeat-getting-started.html)
- Make sure you receive the data in ES base
- Grafana: Add the Elasticsearch source (https://grafana.com/docs/grafana/latest/features/datasources/elasticsearch/)
- Import the dashboard json into Grafana (https://grafana.com/docs/grafana/latest/reference/export_import/)
- Customise your dashboard
Metricbeat version: 5.5.2 Elasticsearch : v5.6.8 Grafana : v6.2.1
Data source config
Collector type:
Collector plugins:
Collector config:
Revisions
Upload an updated version of an exported dashboard.json file from Grafana
| Revision | Description | Created | |
|---|---|---|---|
| Download |