Network Monitoring
The dashboard accompanying https://github.com/deviavir/k8s-quin
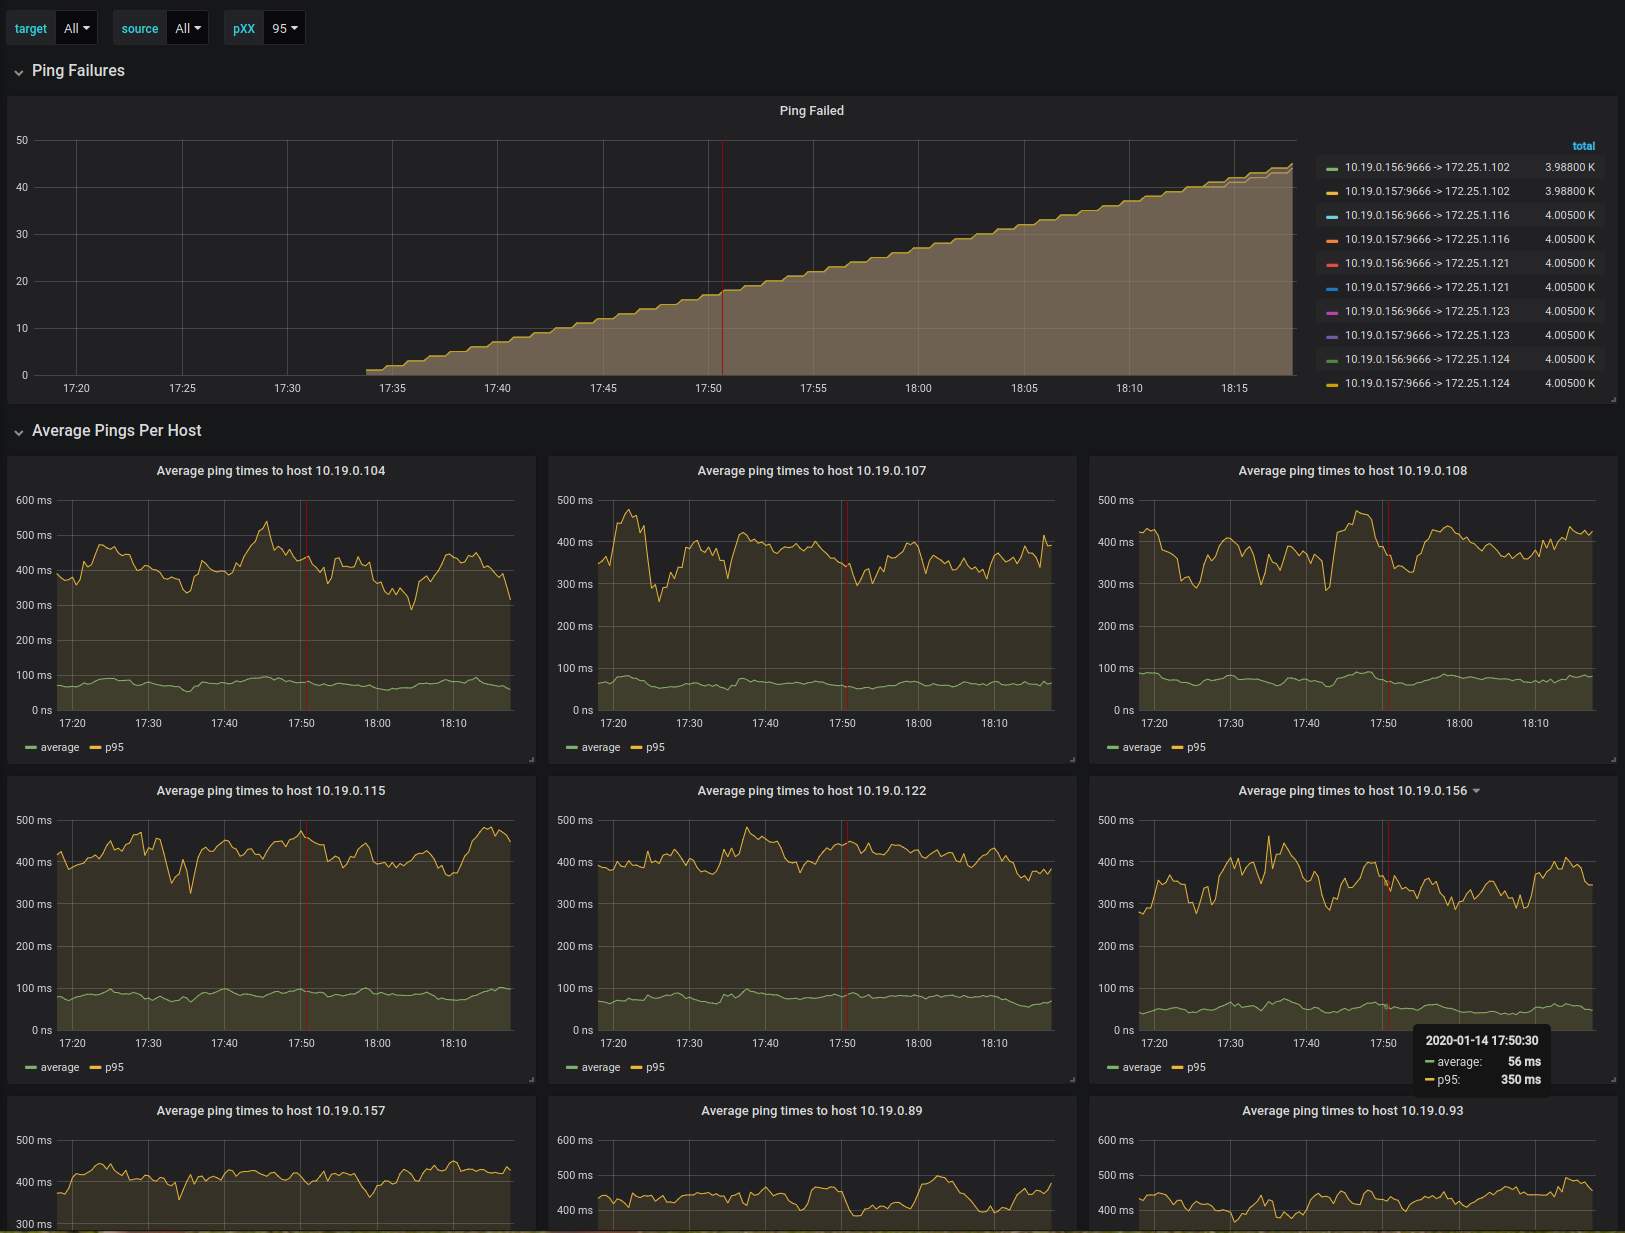
After having deployed https://github.com/deviavir/k8s-quin into your cluster, you can use the prometheus operator to automatically scrape these metrics that will then be picked up by this dashboard.
The "source" variable may need some customizing depending on your prometheus setup.
Data source config
Collector type:
Collector plugins:
Collector config:
Revisions
Upload an updated version of an exported dashboard.json file from Grafana
| Revision | Description | Created | |
|---|---|---|---|
| Download |