1 Node Dashboard for Prometheus 中文版
1 Node Dashboard for Prometheus 中文版 Node节点总览
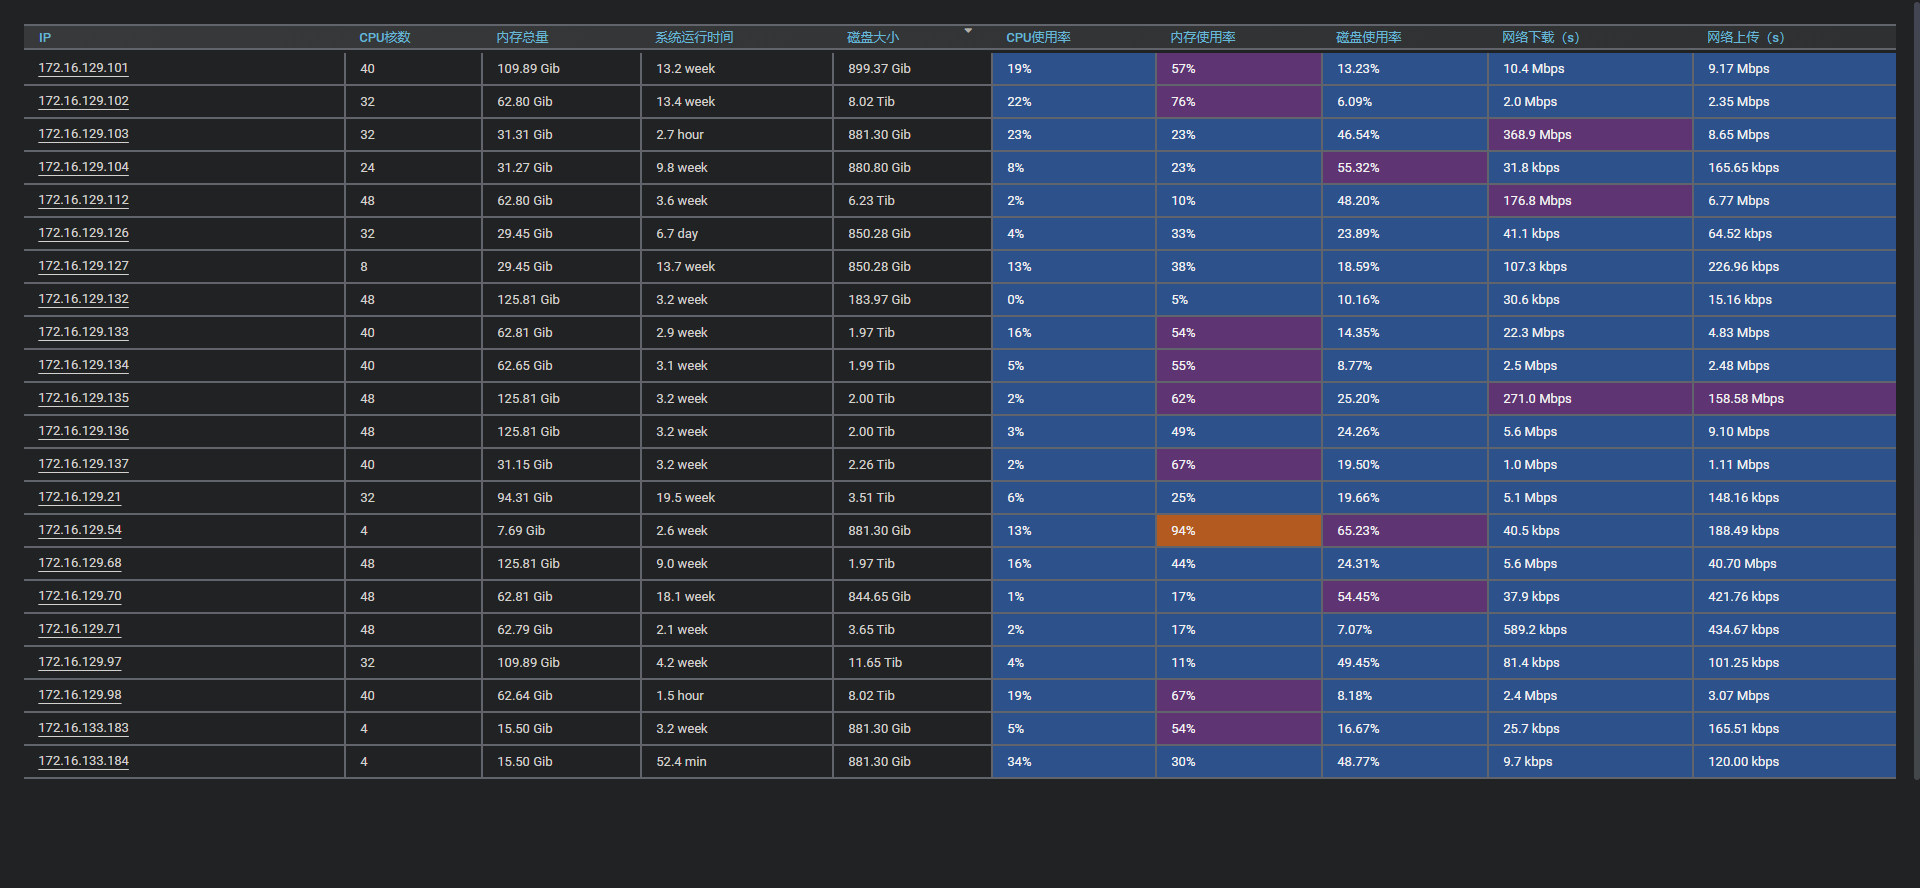
Node节点总览
E-mail: henry525@qq.com
Data source config
Collector type:
Collector plugins:
Collector config:
Revisions
Upload an updated version of an exported dashboard.json file from Grafana
| Revision | Description | Created | |
|---|---|---|---|
| Download |
Linux Server
Monitor Linux with Grafana. Easily monitor your Linux deployment with Grafana Cloud's out-of-the-box monitoring solution.
Learn more