
MS SQL servers
Dashboard for Microsoft SQL server with Prometheus and Telegraf SQL plugin version 2.
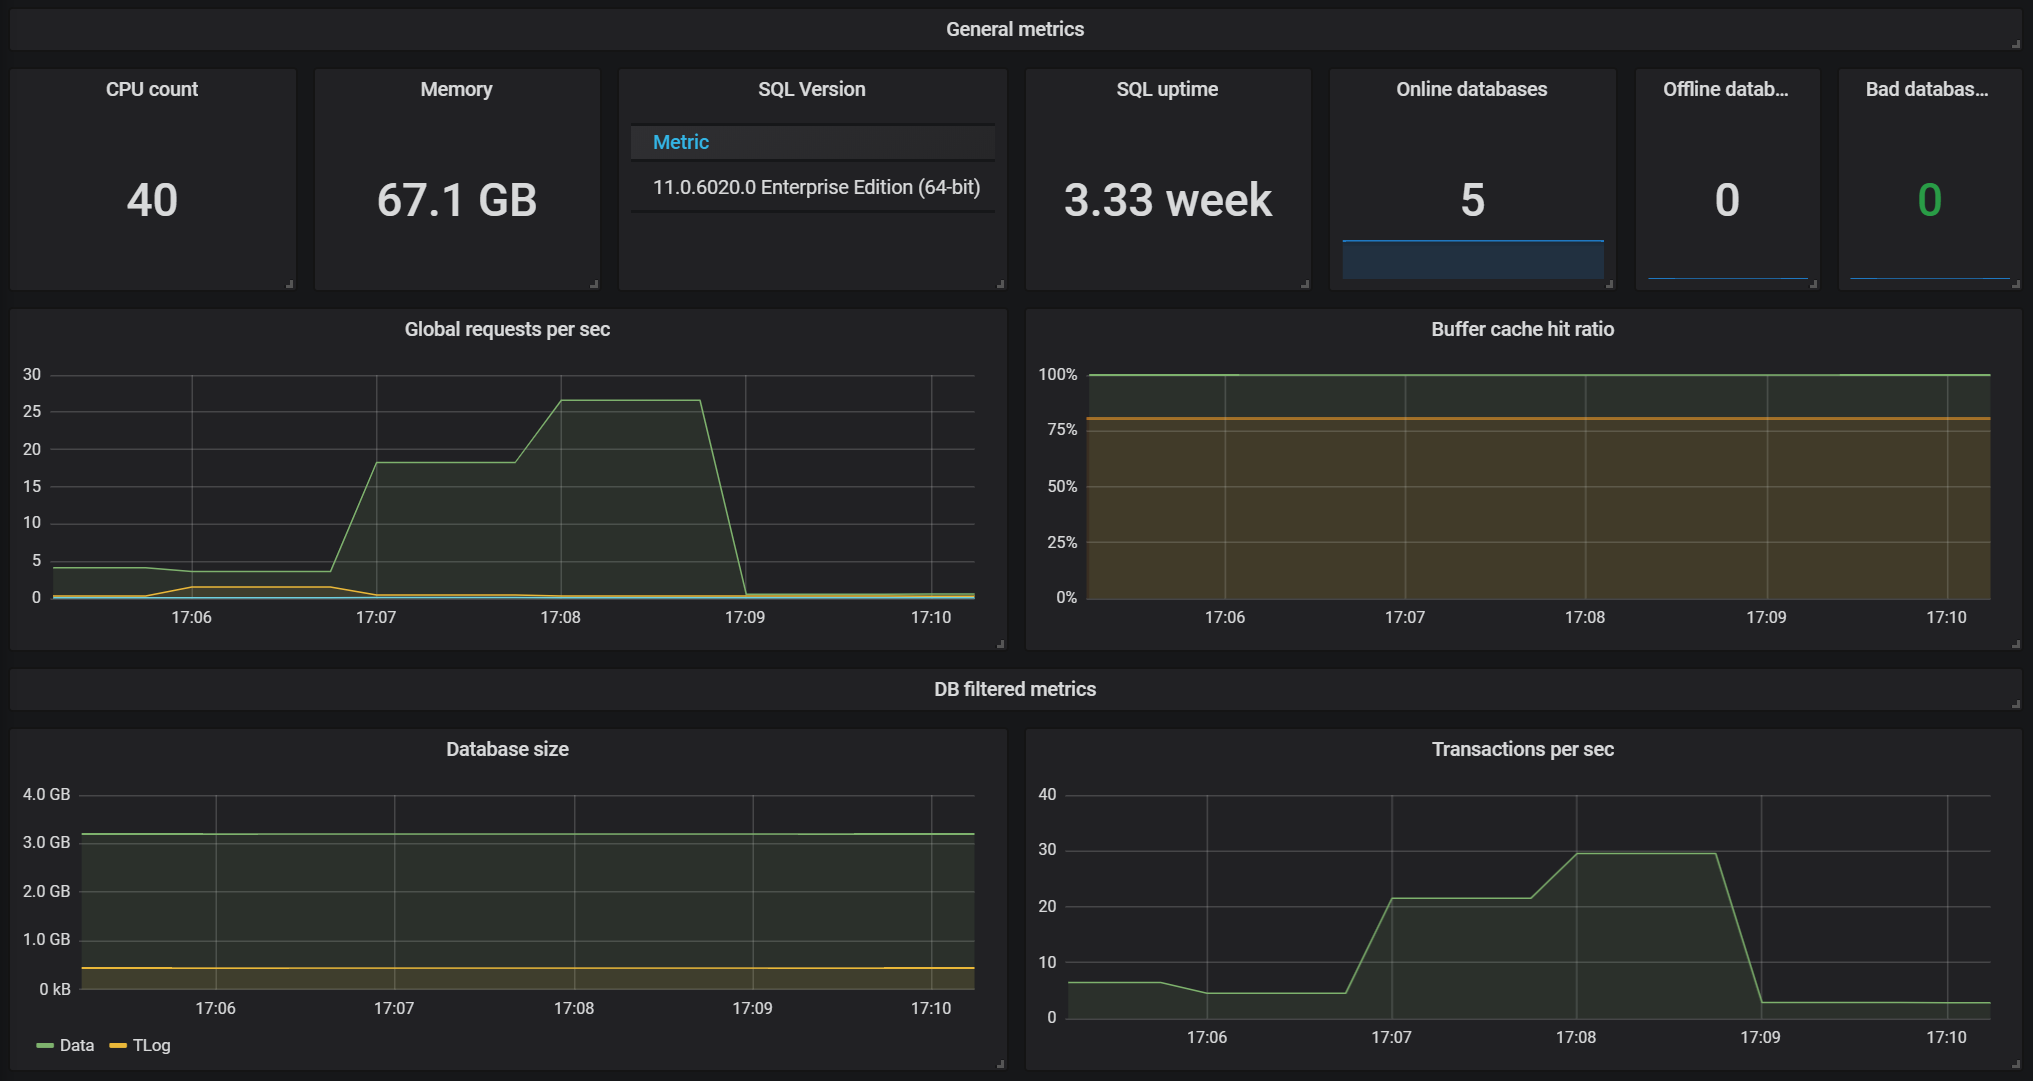
This is a dashboard for Microsoft SQL server with Prometheus and Telegraf SQL plugin version 2. It displays global statistics and where is possible metrics per database. List:
- Global
- CPU/Memory/SQL version/ Uptime
- Database status (Offline, Online, Bad)
- Global requests per sec/Buffer cache hit ratio
- Per database
- Size
- Transactions/IO stats
Data source config
Collector type:
Collector plugins:
Collector config:
Dashboard revisions
Upload an updated version of an exported dashboard.json file from Grafana
| Revision | Decscription | Created | |
|---|---|---|---|
| Download |
Sign up for Grafana Cloud

Get up and running in minutes with the Grafana Cloud free tier, which includes free forever 10k metrics, 50GB logs, 50GB traces, 500 VUh, and more.
Get this dashboard
Data source:
Dependencies: