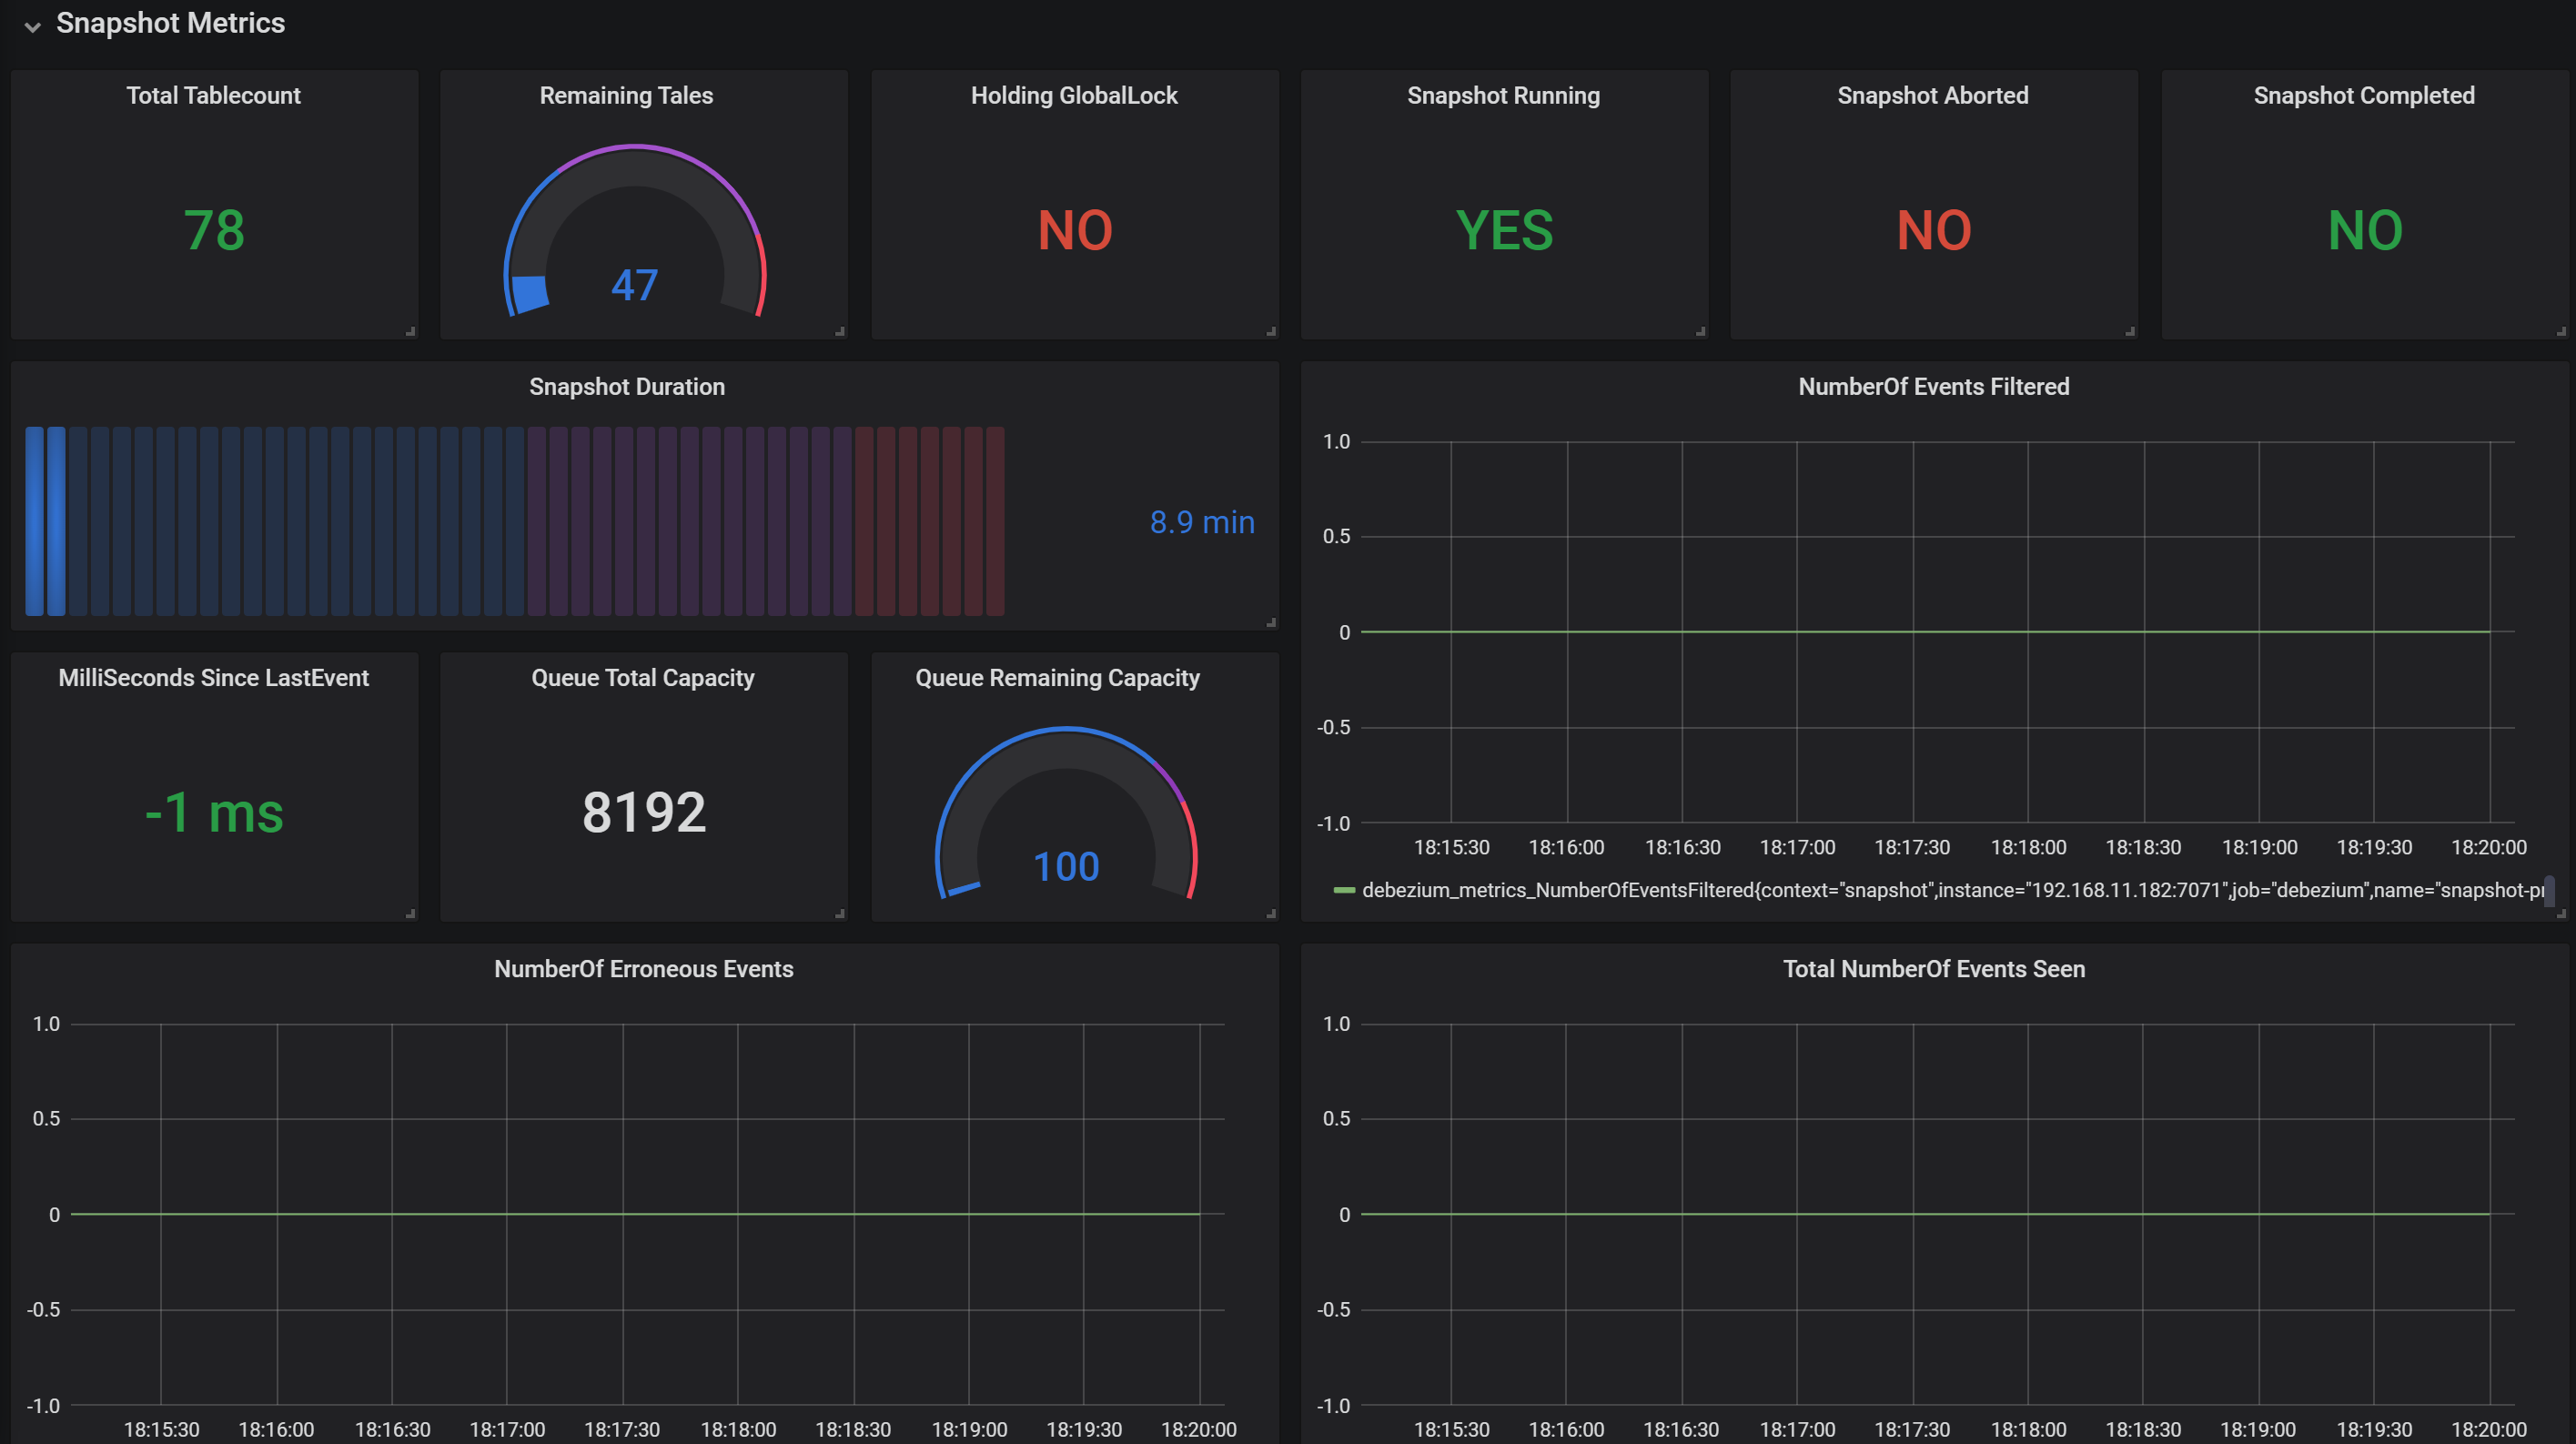
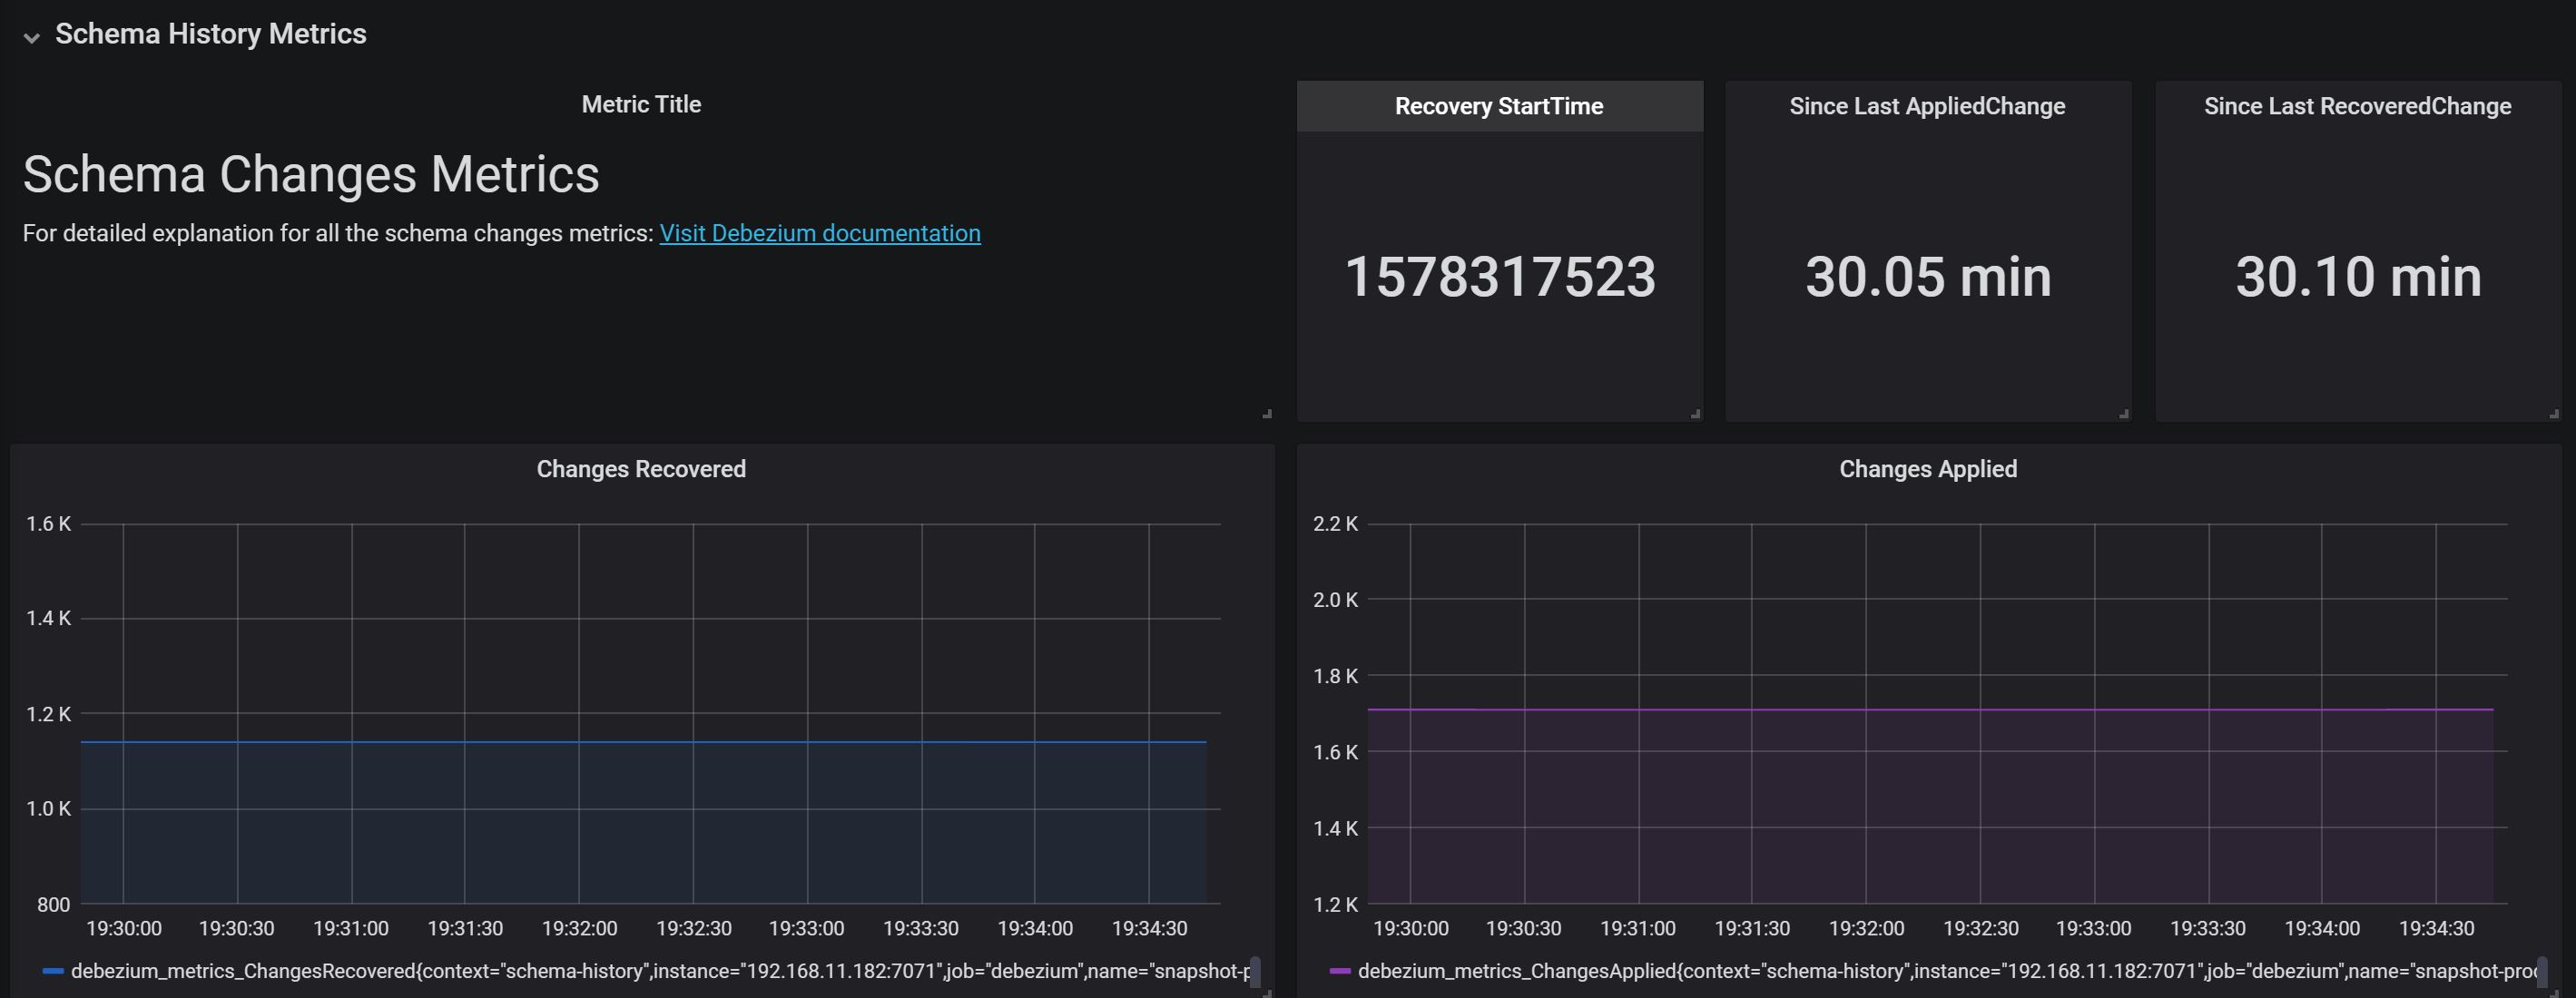
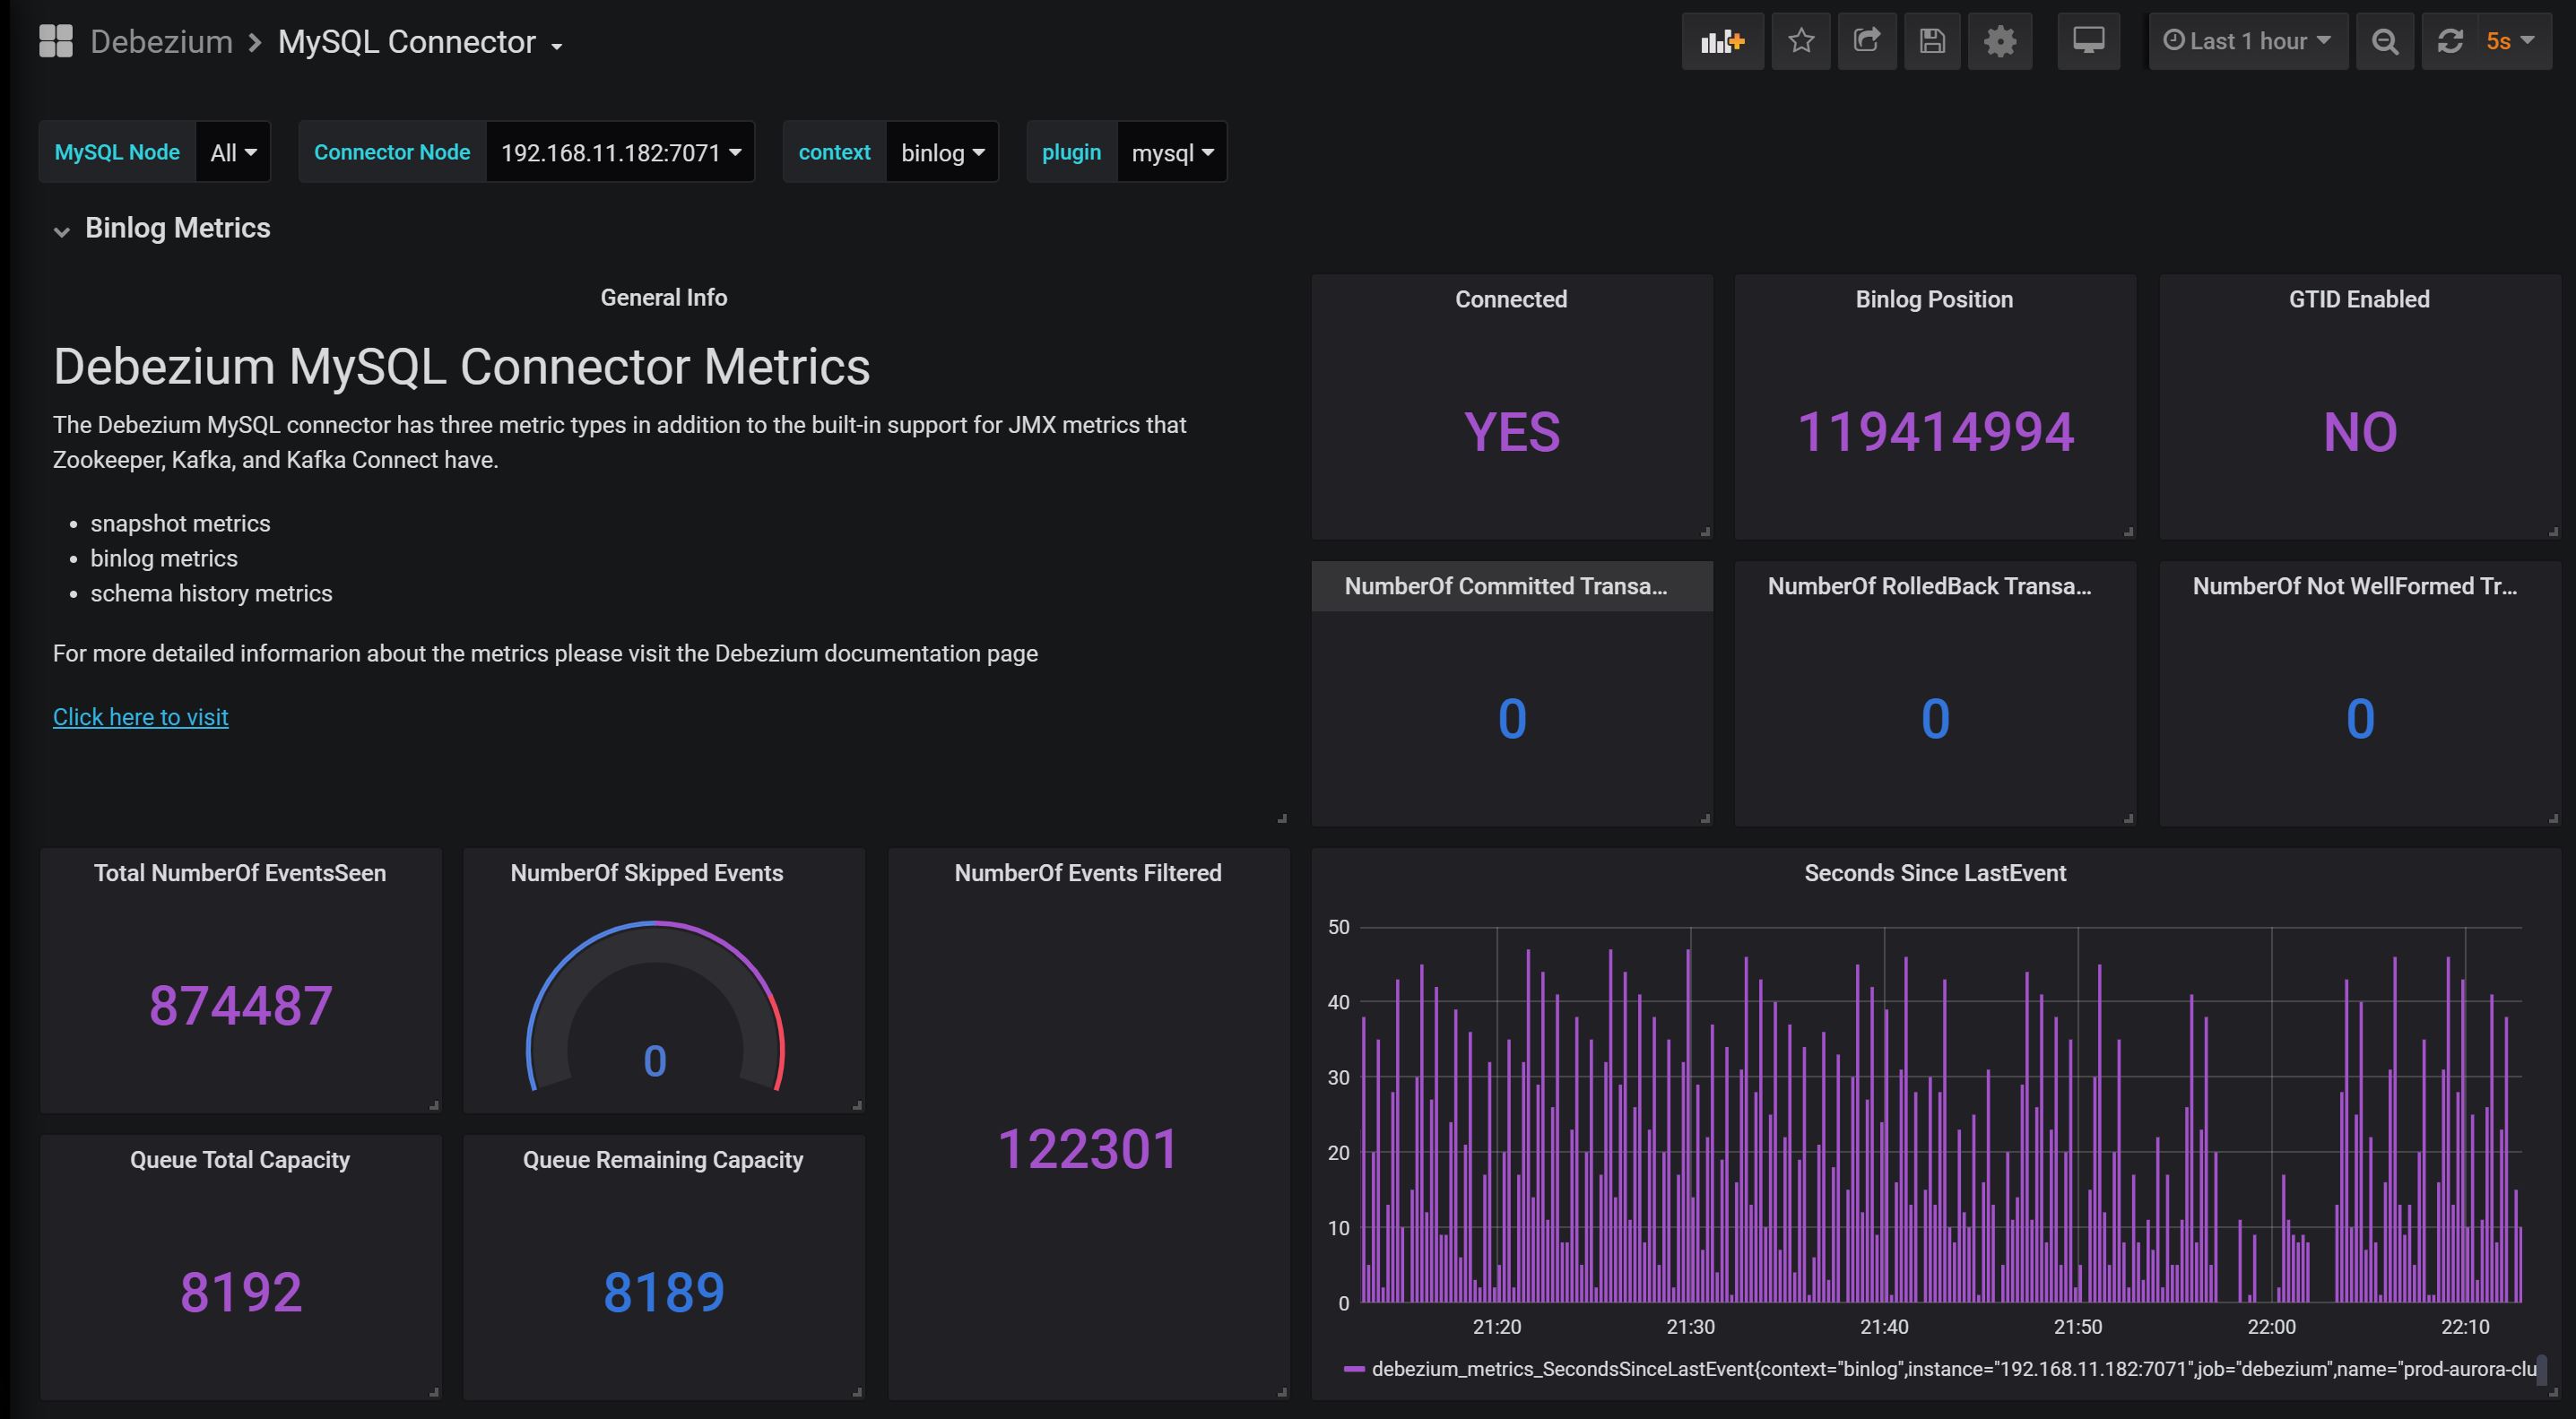
Debezium MySQL Connector
Monitoring Dashboard for Debezium MySQL connector.
You need to install and configure the JMX exporter.
Read here for configuring Monitoring: https://thedataguy.in/monitor-debezium-mysql-connector-with-prometheus-and-grafana/
More configuration details about this dashboard: https://medium.com/searce/grafana-dashboard-for-monitoring-debezium-mysql-connector-d5c28acf905b
To contribute to this dashboard, please visit this GitHub link. https://github.com/debezium/debezium-examples/tree/master/monitoring/debezium-grafana
Data source config
Collector type:
Collector plugins:
Collector config:
Revisions
Upload an updated version of an exported dashboard.json file from Grafana
| Revision | Description | Created | |
|---|---|---|---|
| Download |
MySQL
Monitor MySQL with Grafana. Easily monitor your MySQL deployment with Grafana Cloud's out-of-the-box monitoring solution.
Learn more