dask
Monitor an auto-scaling Dask cluster, including a dynamic view of active workers.
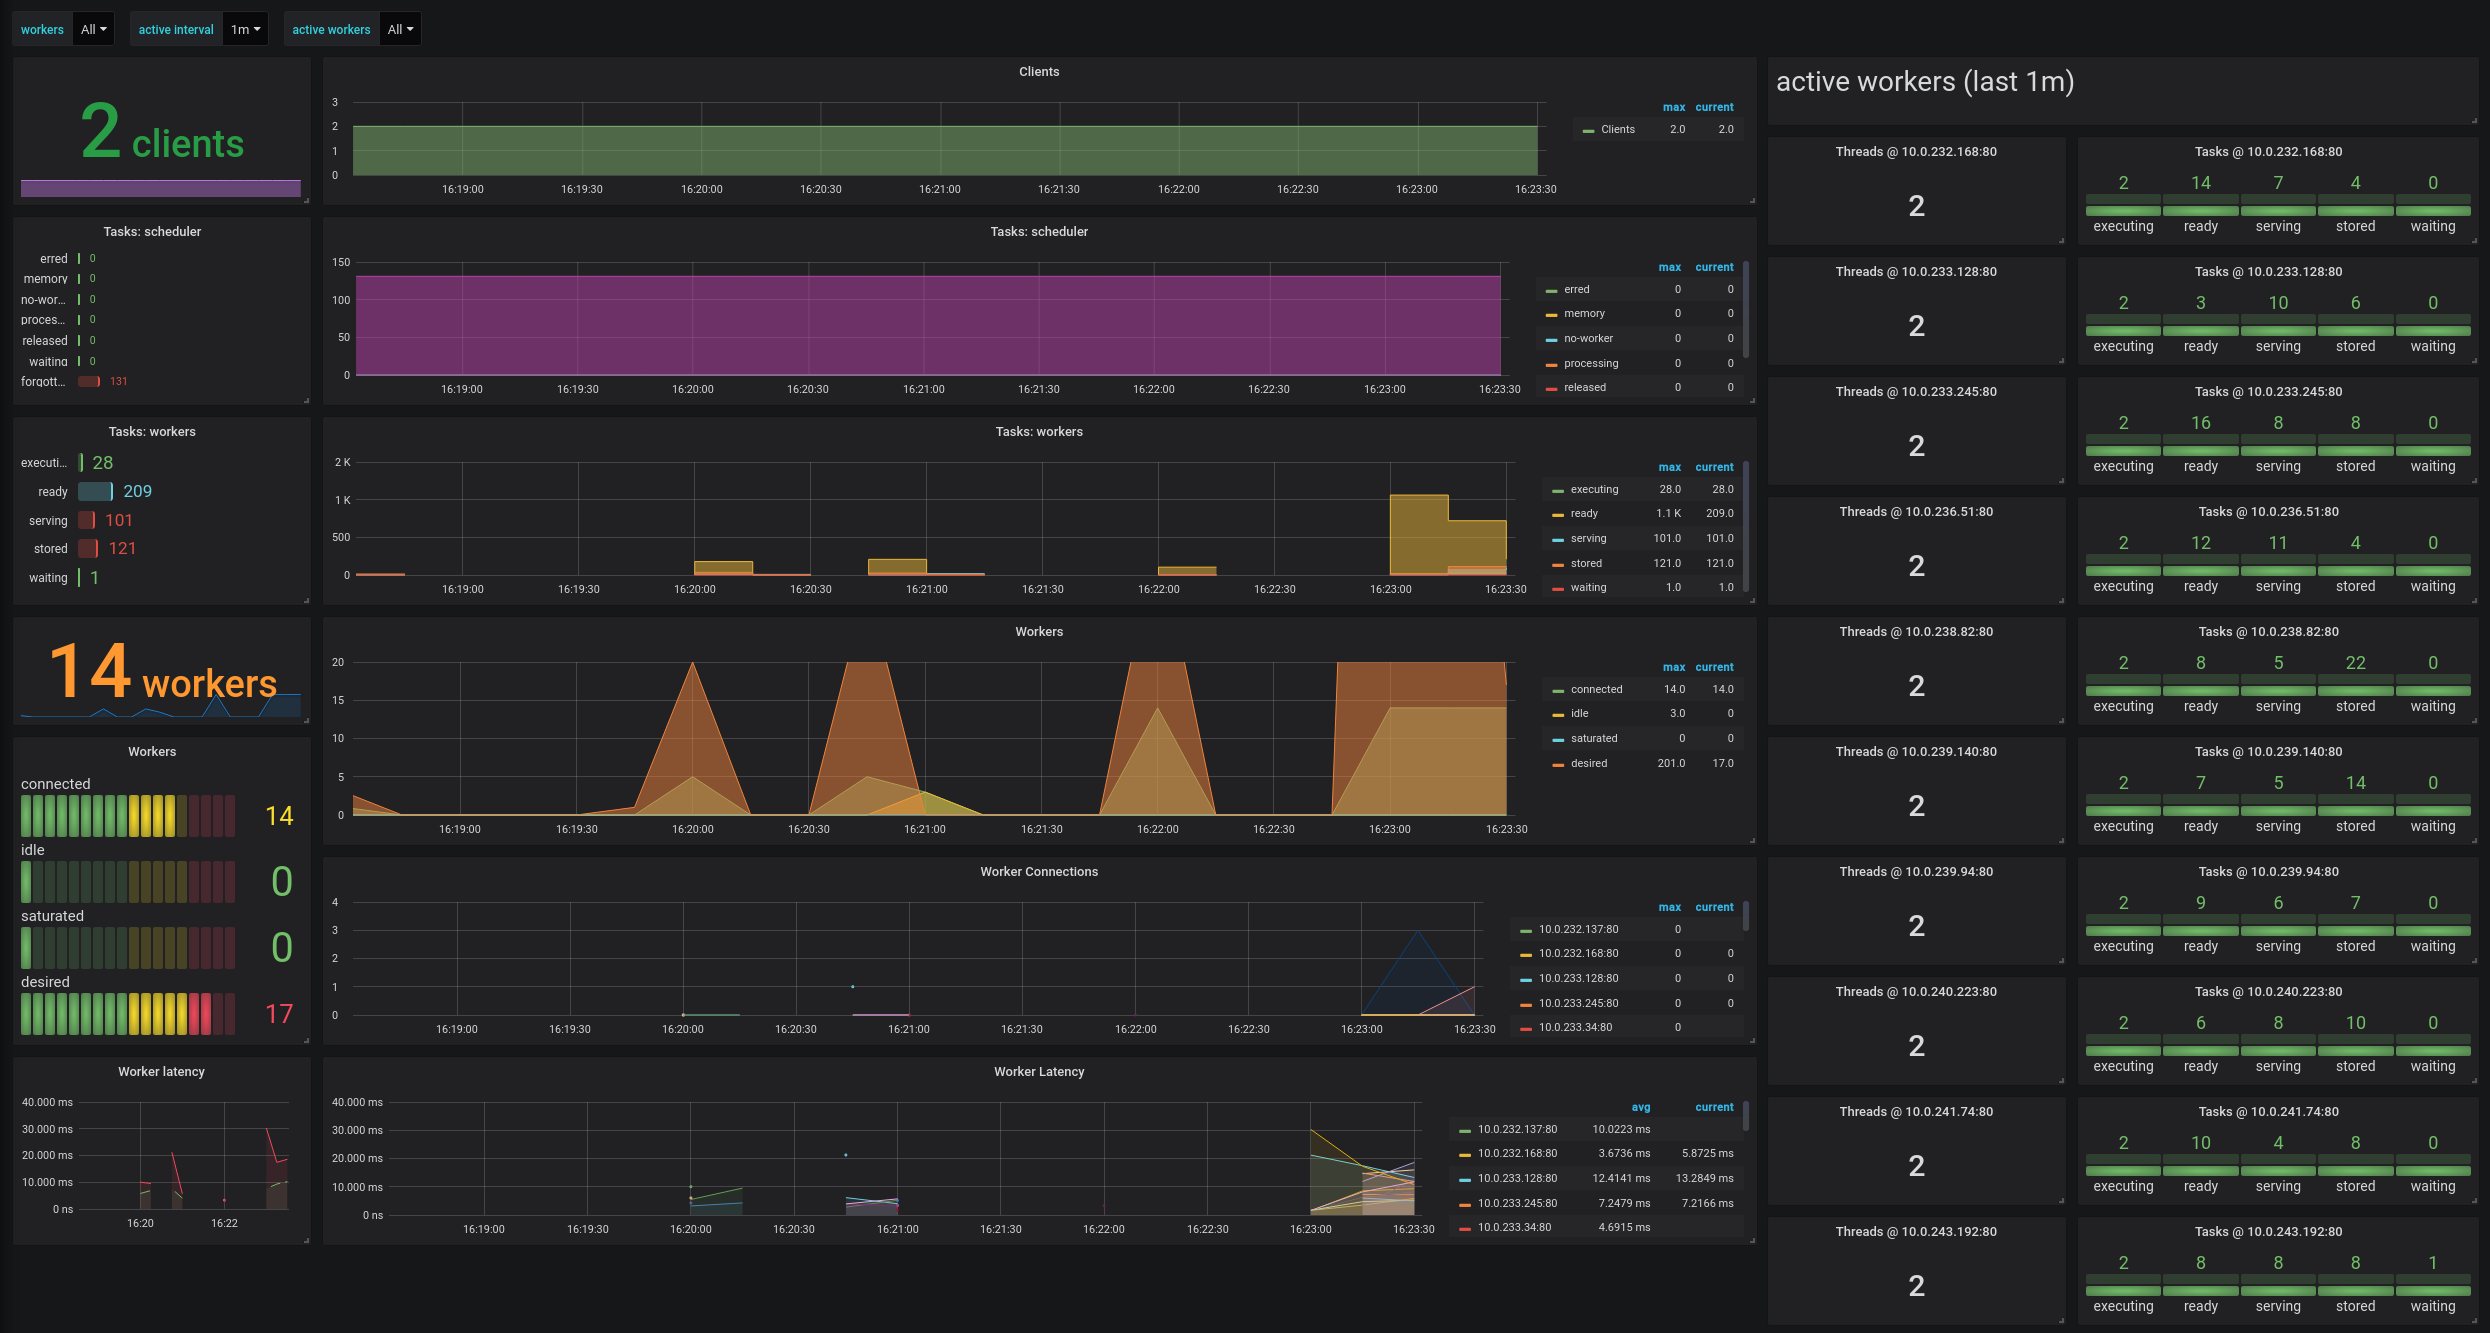
This dashboard displays metrics collected from an auto-scaling Dask cluster, including a dynamic view of active workers. While we use Dask Kubernetes deployment for deployment, other scenarios are also possible.
The dask metrics are exposed to Prometheus as described in https://distributed.dask.org/en/latest/prometheus.html
Corresponding scrapers are defined in prometheus.yml. For example, scheduler metrics from dashboard.dask:8787/metrics are collected using:
    - job_name: 'dask-scheduler'
      scrape_interval: 5s
      static_configs:
        - targets: ['dashboard.dask:8787']
Worker metrics from workers spawned with Dask Kubernetes can be collected in-cluster via the following job:
    - job_name: 'dask-workers'
      kubernetes_sd_configs:
        - role: pod
      relabel_configs:
        - source_labels: [__meta_kubernetes_pod_label_app, __meta_kubernetes_pod_label_dask_org_component]
          regex: dask;worker
          action: keep
Data source config
Collector type:
Collector plugins:
Collector config:
Revisions
Upload an updated version of an exported dashboard.json file from Grafana
| Revision | Description | Created | |
|---|---|---|---|
| Download |