
JMeter Load Test
This dashboard shows live load test metrics provided by JMeter.
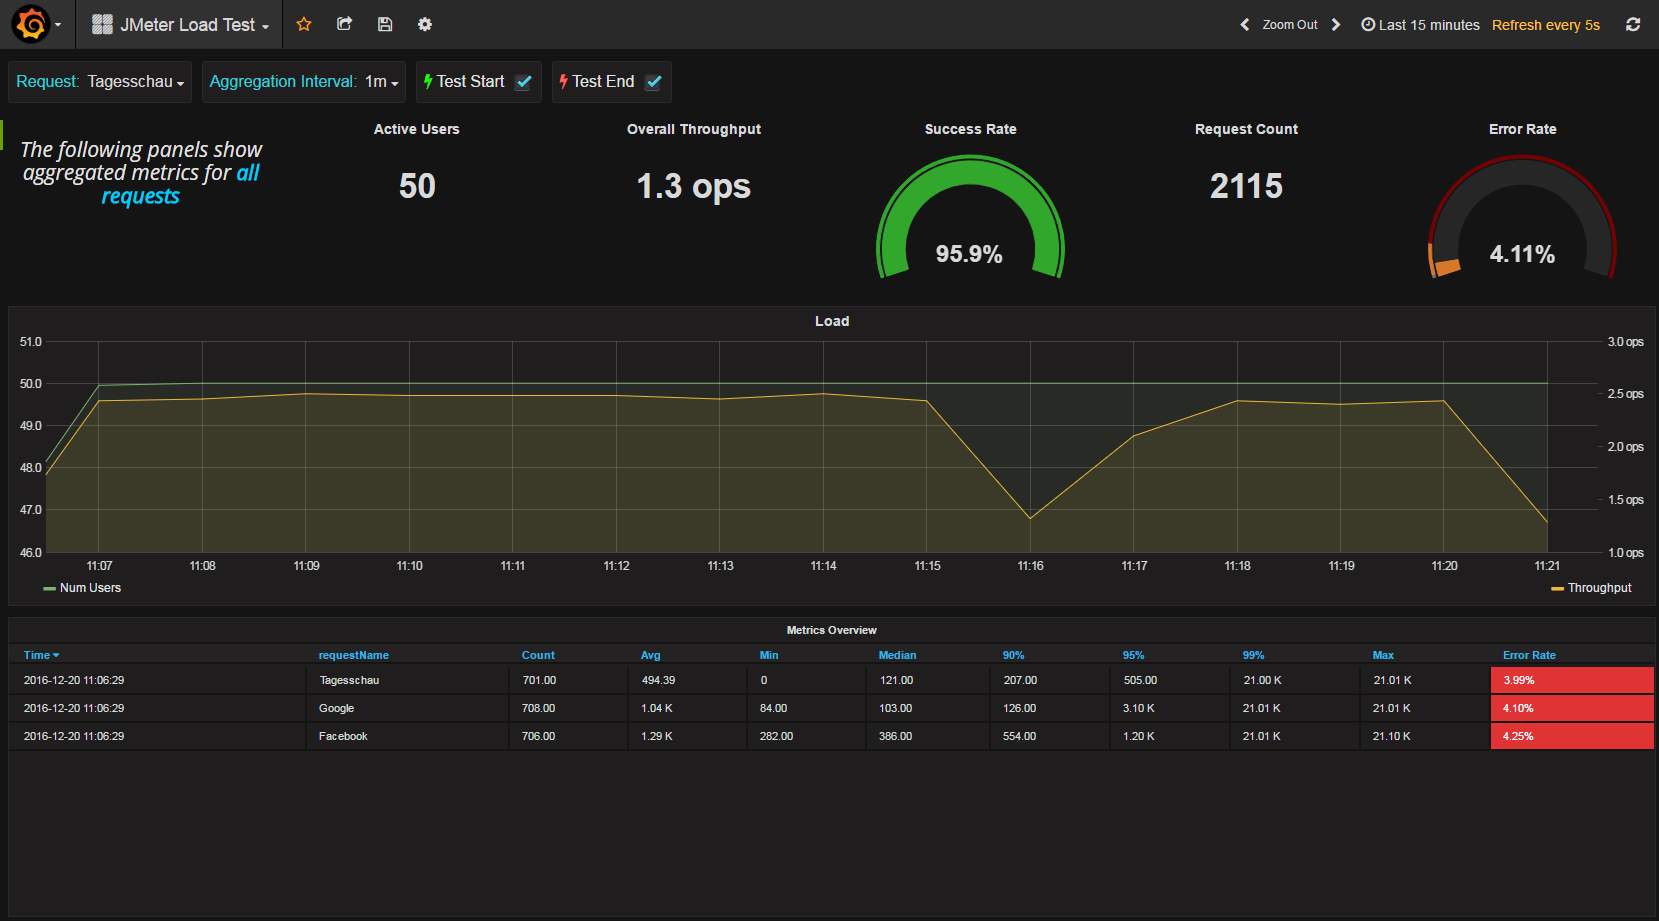
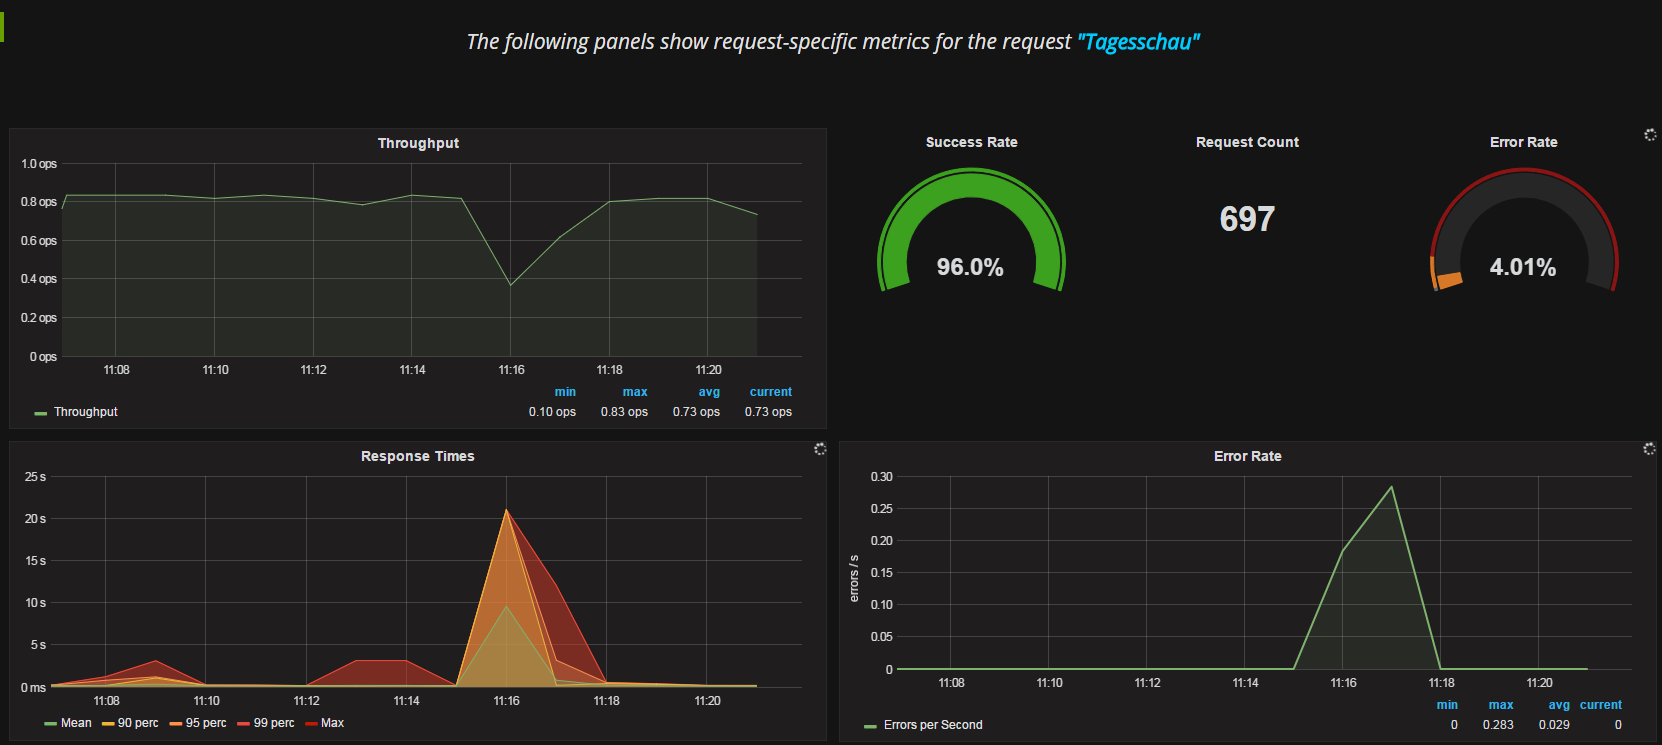
JMeter Load Test Dashboard
This dashboard shows the main metrics gathered during a load test execution with JMeter. This dashboards depends on the JMeter-InfluxBD-Writer plugin for JMeter, that writes live load test data to an influxDB installation.
Prerequisites
Setting up JMeter
- Download the JMeter-InfluxBD-Writer and paste the jar into the /lib/ext directory of your JMeter installation. (Then Restart JMeter)
- In your JMeter load script add a Backend Listener node (Add -> Listener -> Backend Listener)
- Select JMeterInfluxDBBackendListenerClient for the Backend Listener implementation option
- Provide in the Parameters table your influxDB settings, provide a name for the test, and specify which samplers to record.
Data source config
Collector type:
Collector plugins:
Collector config:
Dashboard revisions
Upload an updated version of an exported dashboard.json file from Grafana
| Revision | Decscription | Created | |
|---|---|---|---|
| Download |
Sign up for Grafana Cloud

Get up and running in minutes with the Grafana Cloud free tier, which includes free forever 10k metrics, 50GB logs, 50GB traces, 500 VUh, and more.
Get this dashboard
Data source:
Dependencies: