
Telegraf_System_Dashboard_Core
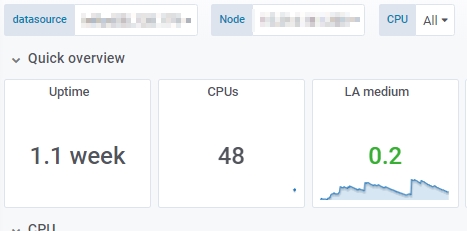
Same as “Telegraf system dashboard” but this one includes a panel showing the number of CPUs.
telegraf.conf
[global_tags]
[agent]
  interval = "10s"
  round_interval = true
  metric_batch_size = 1000
  metric_buffer_limit = 10000
  collection_jitter = "0s"
  flush_interval = "10s"
  flush_jitter = "0s"
  precision = ""
  hostname = ""
  omit_hostname = false
[[outputs.influxdb]]
  urls = ["http://influxDB:8086"]
  database = "telegraf"
[[inputs.cpu]]
  percpu = true
  totalcpu = true
  fielddrop = ["time_*"]
[[inputs.disk]]
  ignore_fs = ["tmpfs", "devtmpfs", "devfs", "iso9660", "overlay", "aufs", "squashfs"]
[[inputs.diskio]]
[[inputs.kernel]]
[[inputs.mem]]
[[inputs.processes]]
[[inputs.swap]]
[[inputs.system]]
[[inputs.net]]
[[inputs.netstat]]
[[inputs.interrupts]]
[[inputs.linux_sysctl_fs]]Data source config
Collector type:
Collector plugins:
Collector config:
Dashboard revisions
Upload an updated version of an exported dashboard.json file from Grafana
| Revision | Decscription | Created | |
|---|---|---|---|
| Download |
Sign up for Grafana Cloud

Get up and running in minutes with the Grafana Cloud free tier, which includes free forever 10k metrics, 50GB logs, 50GB traces, 500 VUh, and more.
Get this dashboard
Data source:
Dependencies: