Loki-Canary
Loki Canary is a standalone app that audits the log capturing performance of Loki.
About
See loki-canary docs for more info about loki-canary.
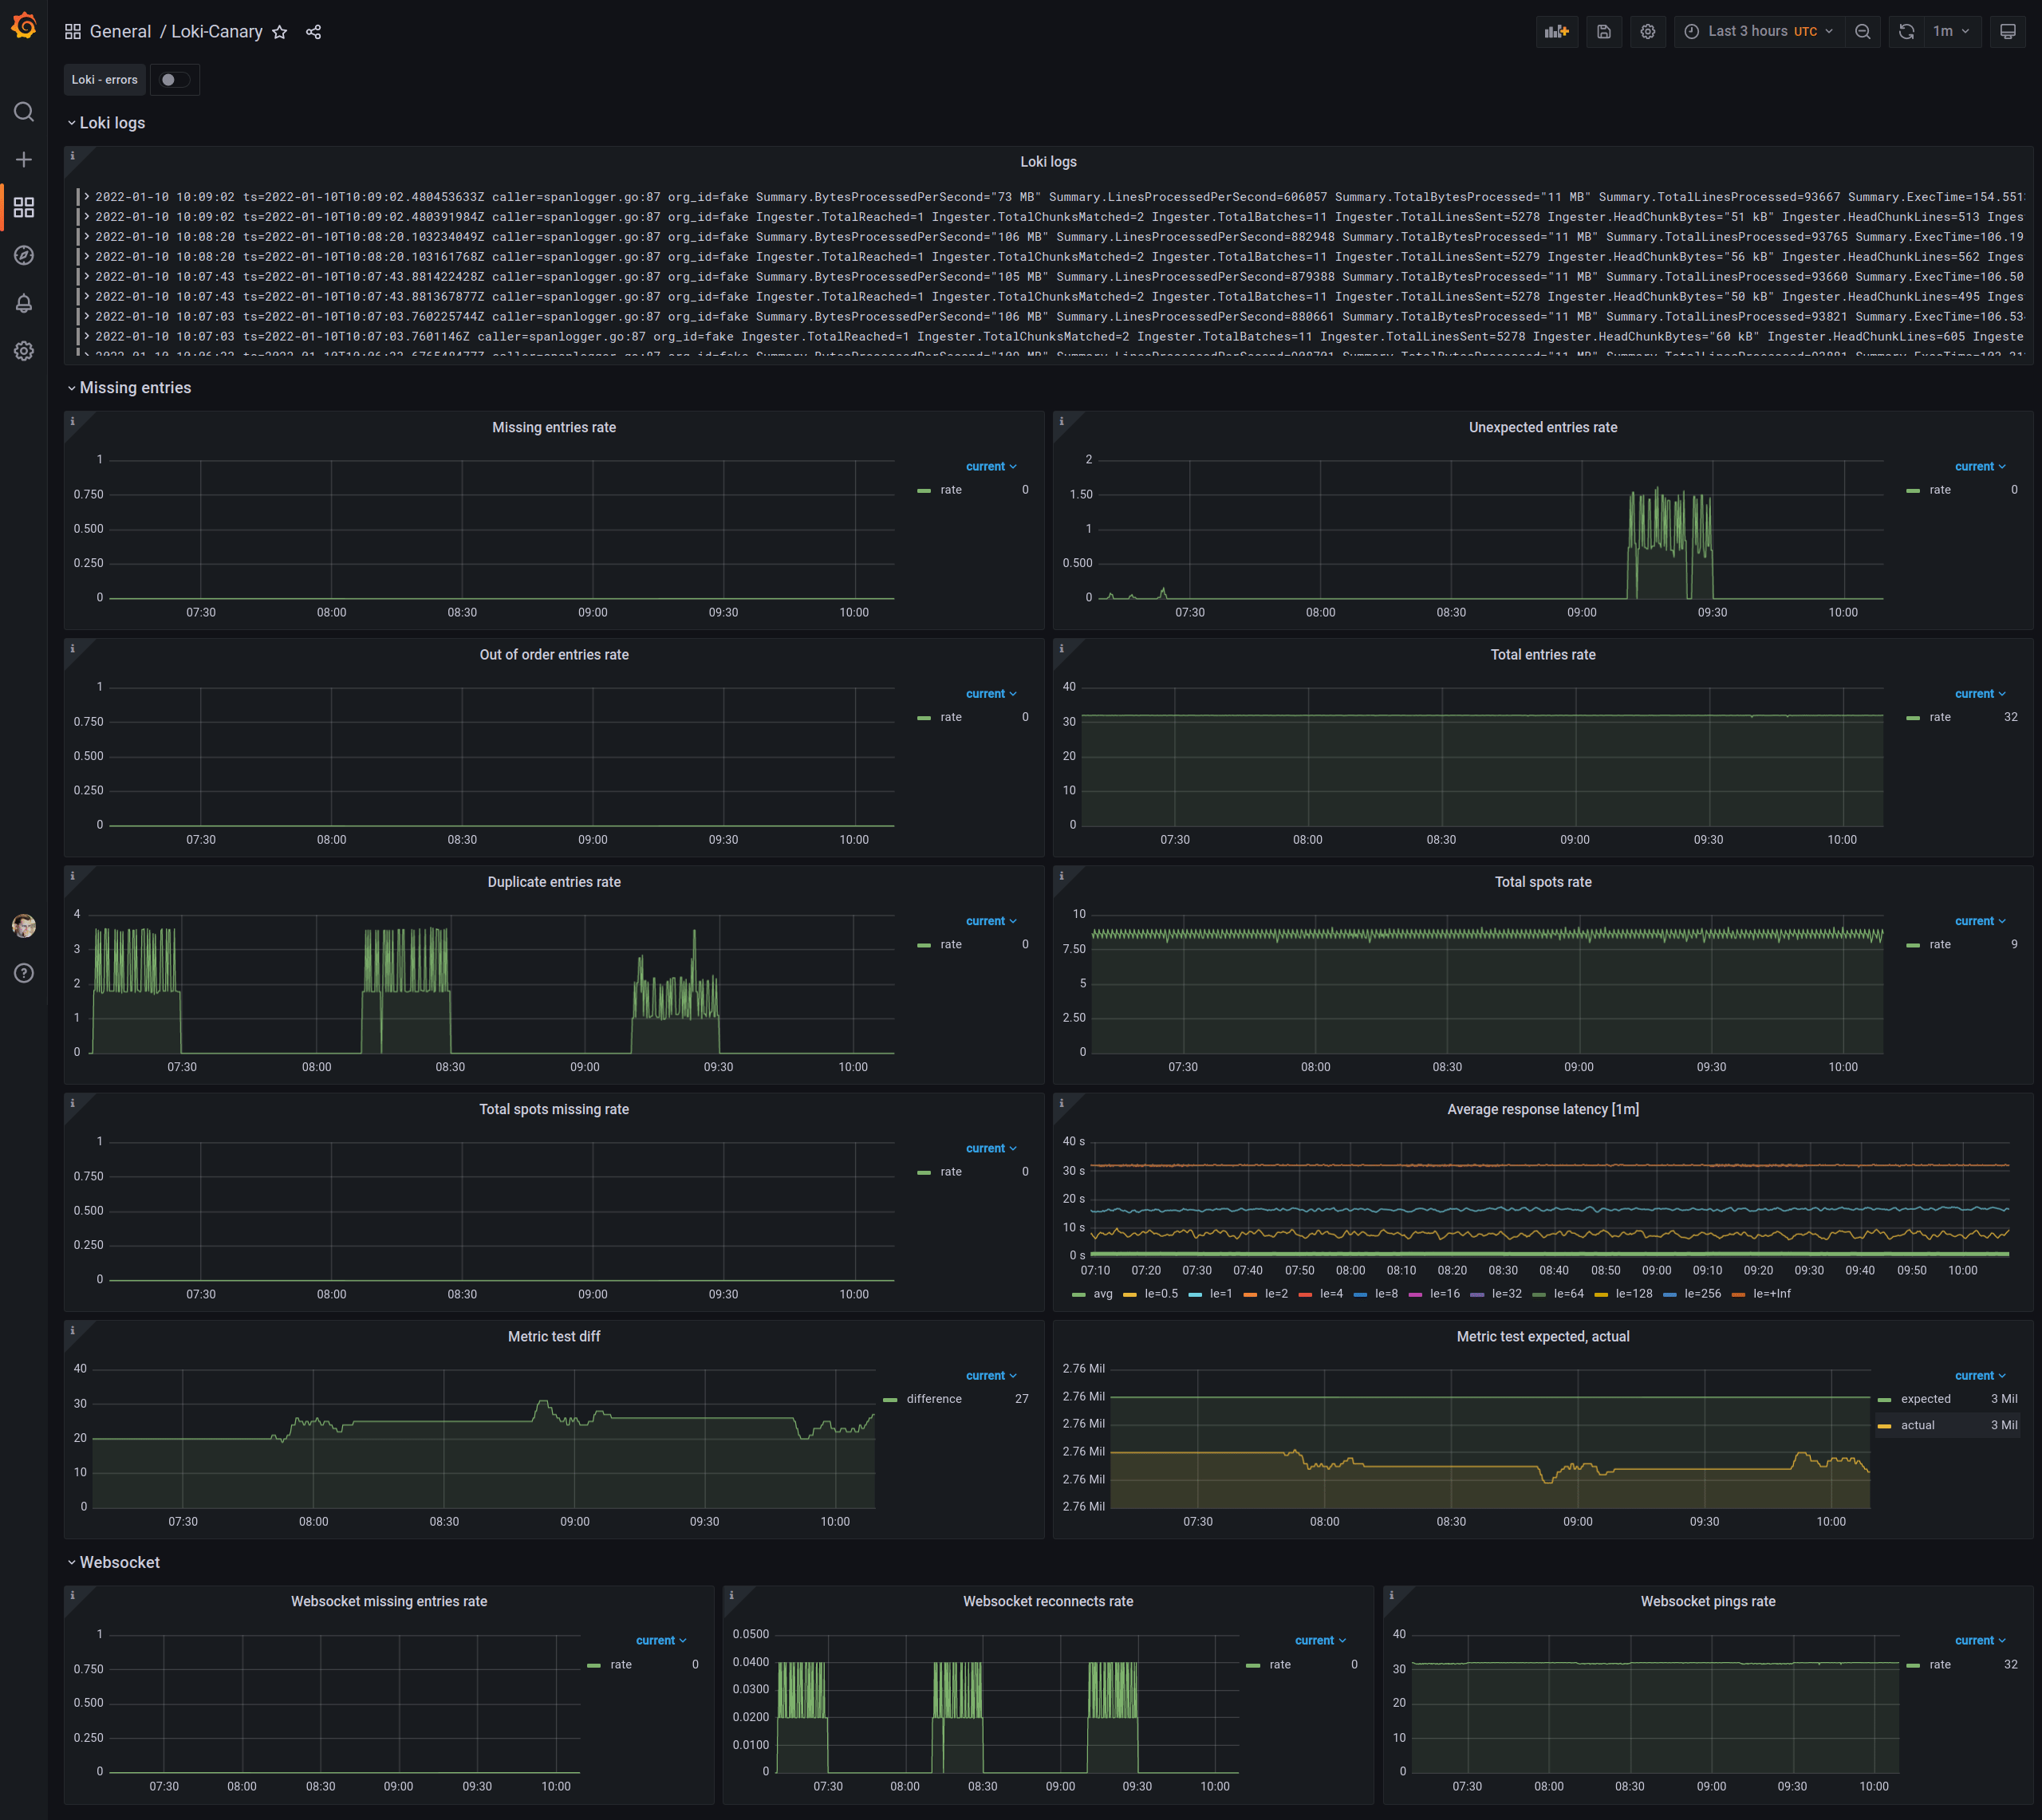
Example dashboard for loki-canary deployed on k8s and with metrics gathered by Prometheus 2.x.
Notice that different revisions are with different app stack (loki/loki-canary/prometheus) Screenshots are from the latest version.
Revisions
Revision 4
Test setup:
- Promtail and Loki deployed from official helm charts - loki/charts using default values
- Loki chart version: "2.6.0 with Loki 2.4.1"
- Promtail chart version: "2.2.0" with Promtail 2.4.1
- Loki-canary chart version: "0.5.1" with Loki-Canary 2.4.1
- using defaults
- prometheus-operator from kube-prometheus-stack chart version: "27.2.0" with no special relabelings
Dashboard changes:
- dashboard uses summarized values, this is required when working with bigger clusters
- updated metrics due to metric name changes in loki-canary
- removed histograms (maybe will re-add in the next revision, will see)
Revision 3 and below
Test setup:
- Promtail and Loki deployed from official helm charts - loki/charts using default values
- Loki chart version: "0.22.0"
- Promtail chart version: "0.16.0"
- Loki-canary deployed from separate yaml files via kubectl -f, which consists of daemonset, service and servicemanager in the setup above logs have labels container_name="loki-canary" and this is used in Loki queries, of course labels depend on promtail relabeling rules
- metrics are gathered by Prometheus 2.x and have labels pod
Revision 3
Dashboard changes:
- added average response latencies
Revision 2
Dashboard changes:
- added rows
- added Loki annotations for lines containing word
error - added new row with Loki logs which are showing everything except standard "pppp..." message (size 100)
Revision 1
Dashboard changes:
- initial dahsboard, simple graphs
References
- loki-canary docs
- loki/charts helm chart
Contact
- contact author if you have any suggestions etc
Data source config
Collector config:
Upload an updated version of an exported dashboard.json file from Grafana
| Revision | Description | Created | |
|---|---|---|---|
| Download |
Grafana Loki (self-hosted)
Easily monitor Grafana Loki (self-hosted), a horizontally scalable, highly available, multi-tenant log aggregation system inspired by Prometheus, with Grafana Cloud's out-of-the-box monitoring solution.
Learn more
