
Istio Ingress Gateway - ElasticSearch
Dashboard for istio ingress gateway
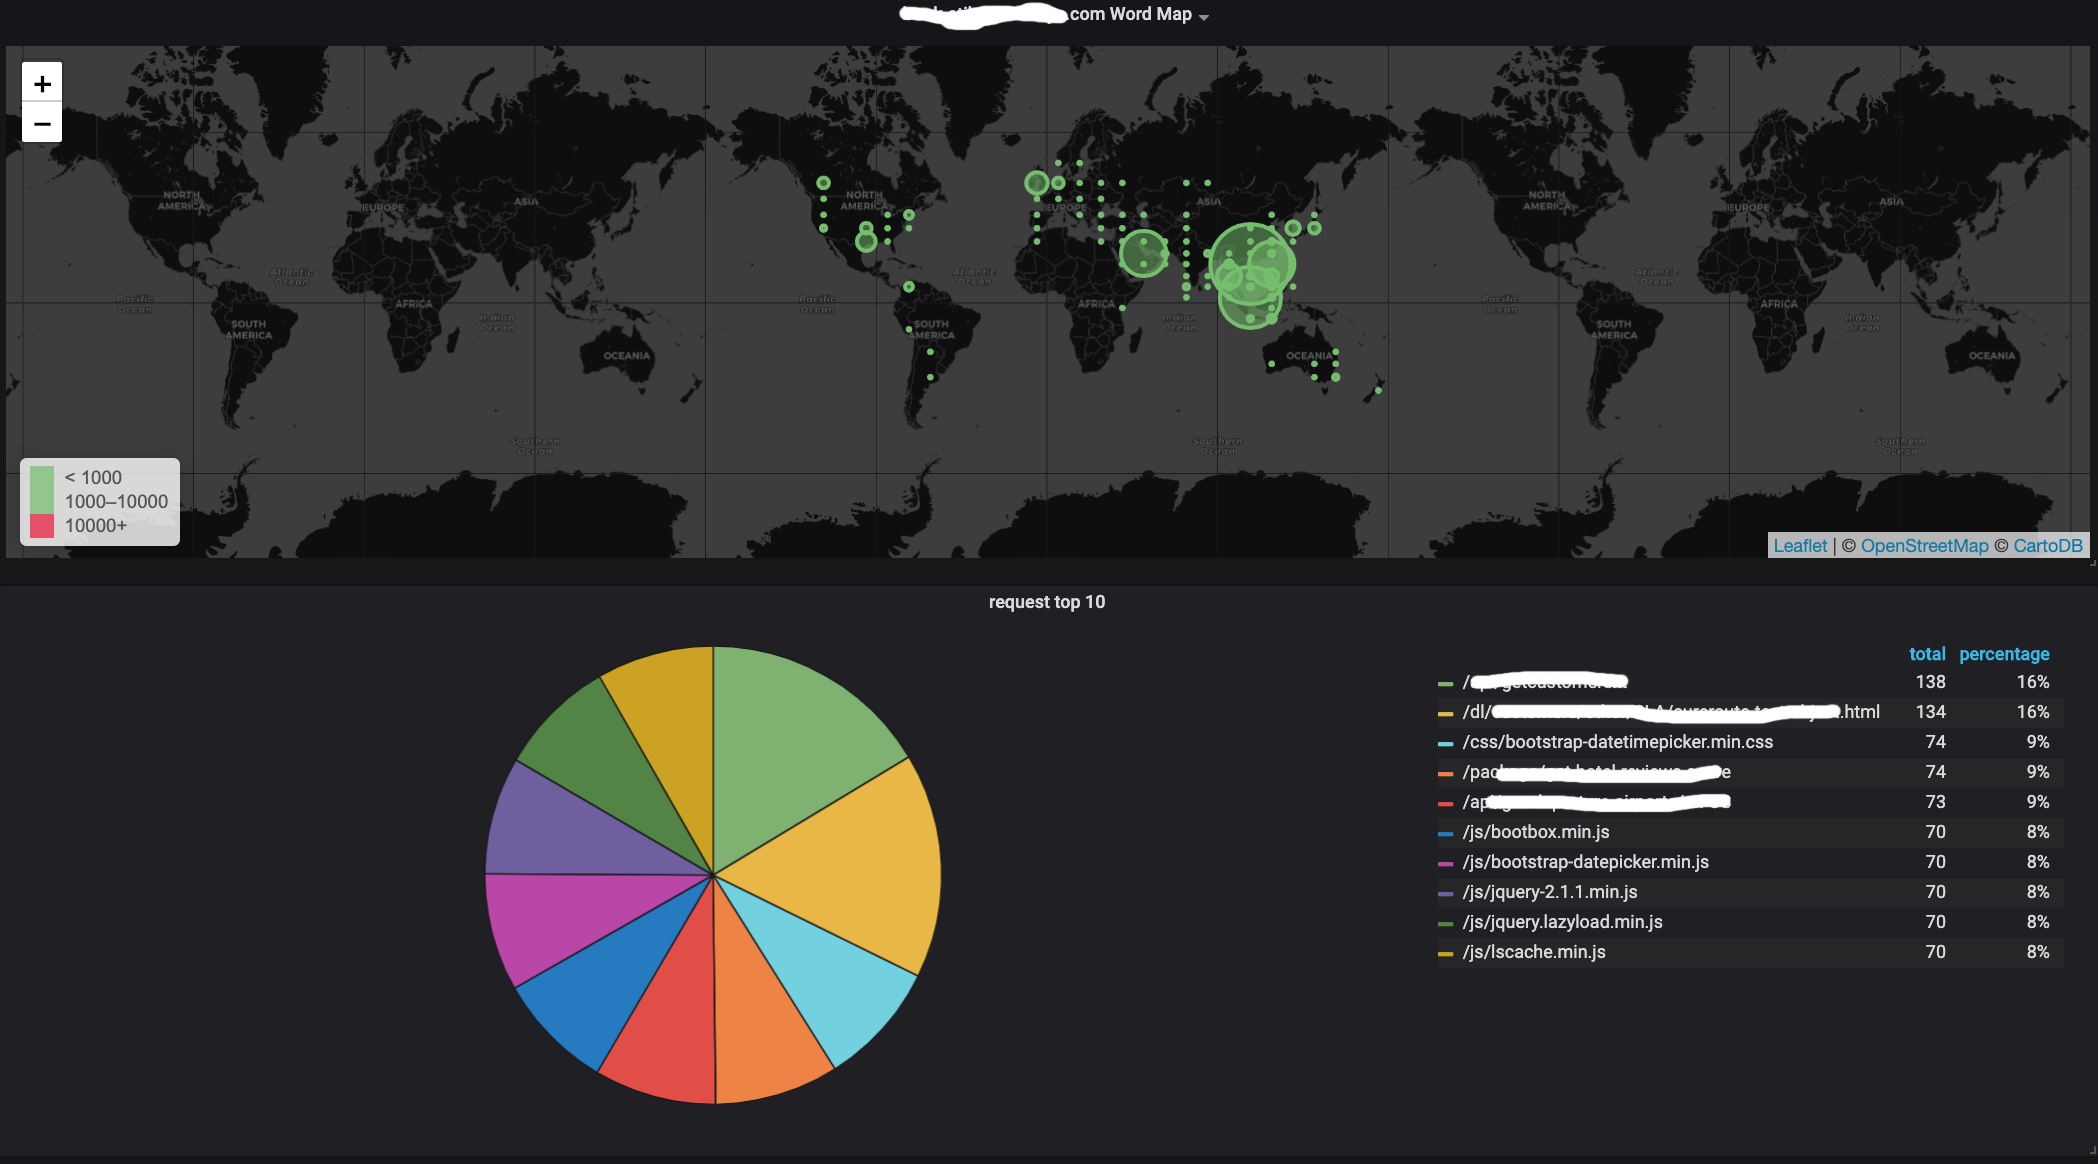
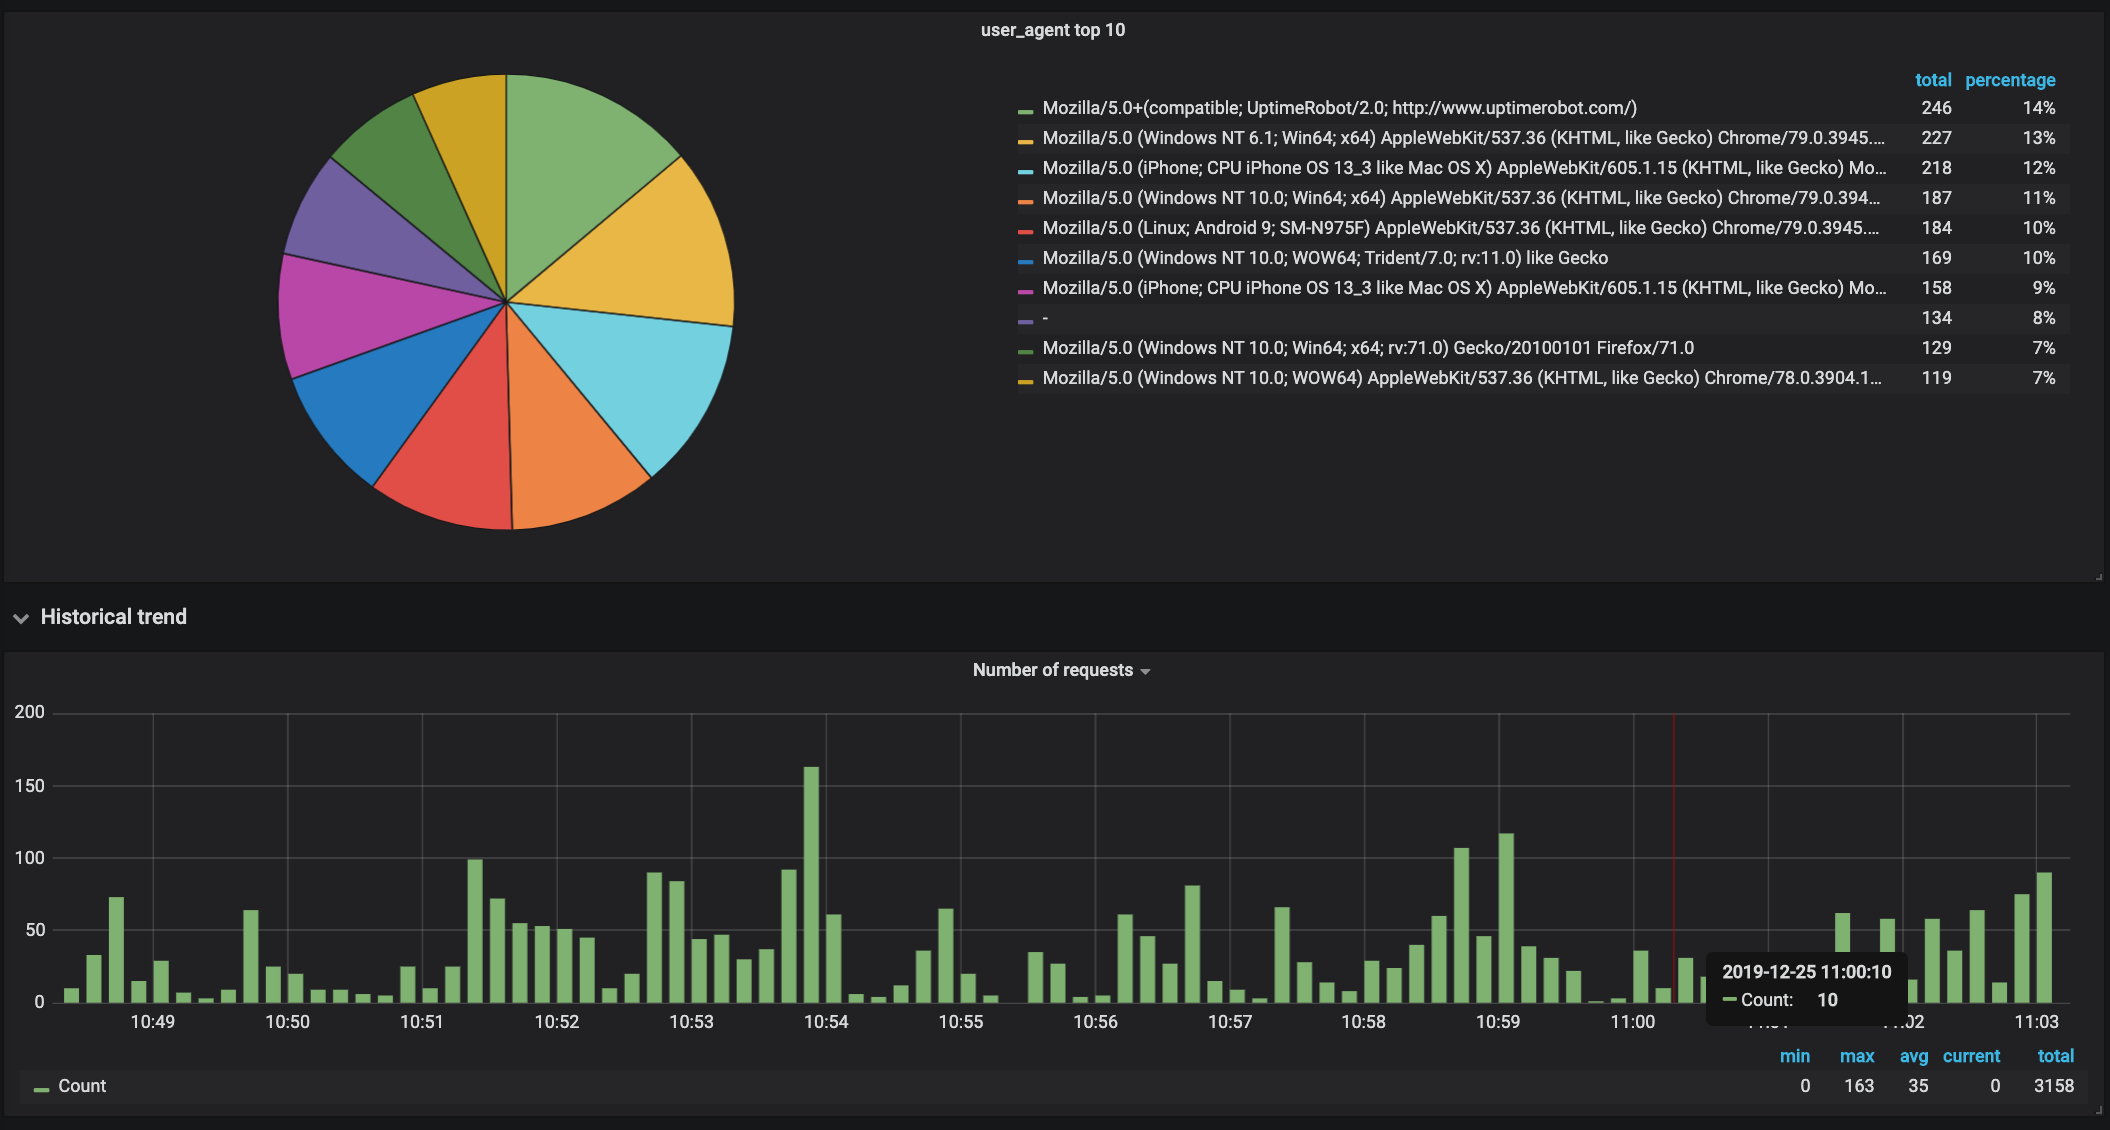
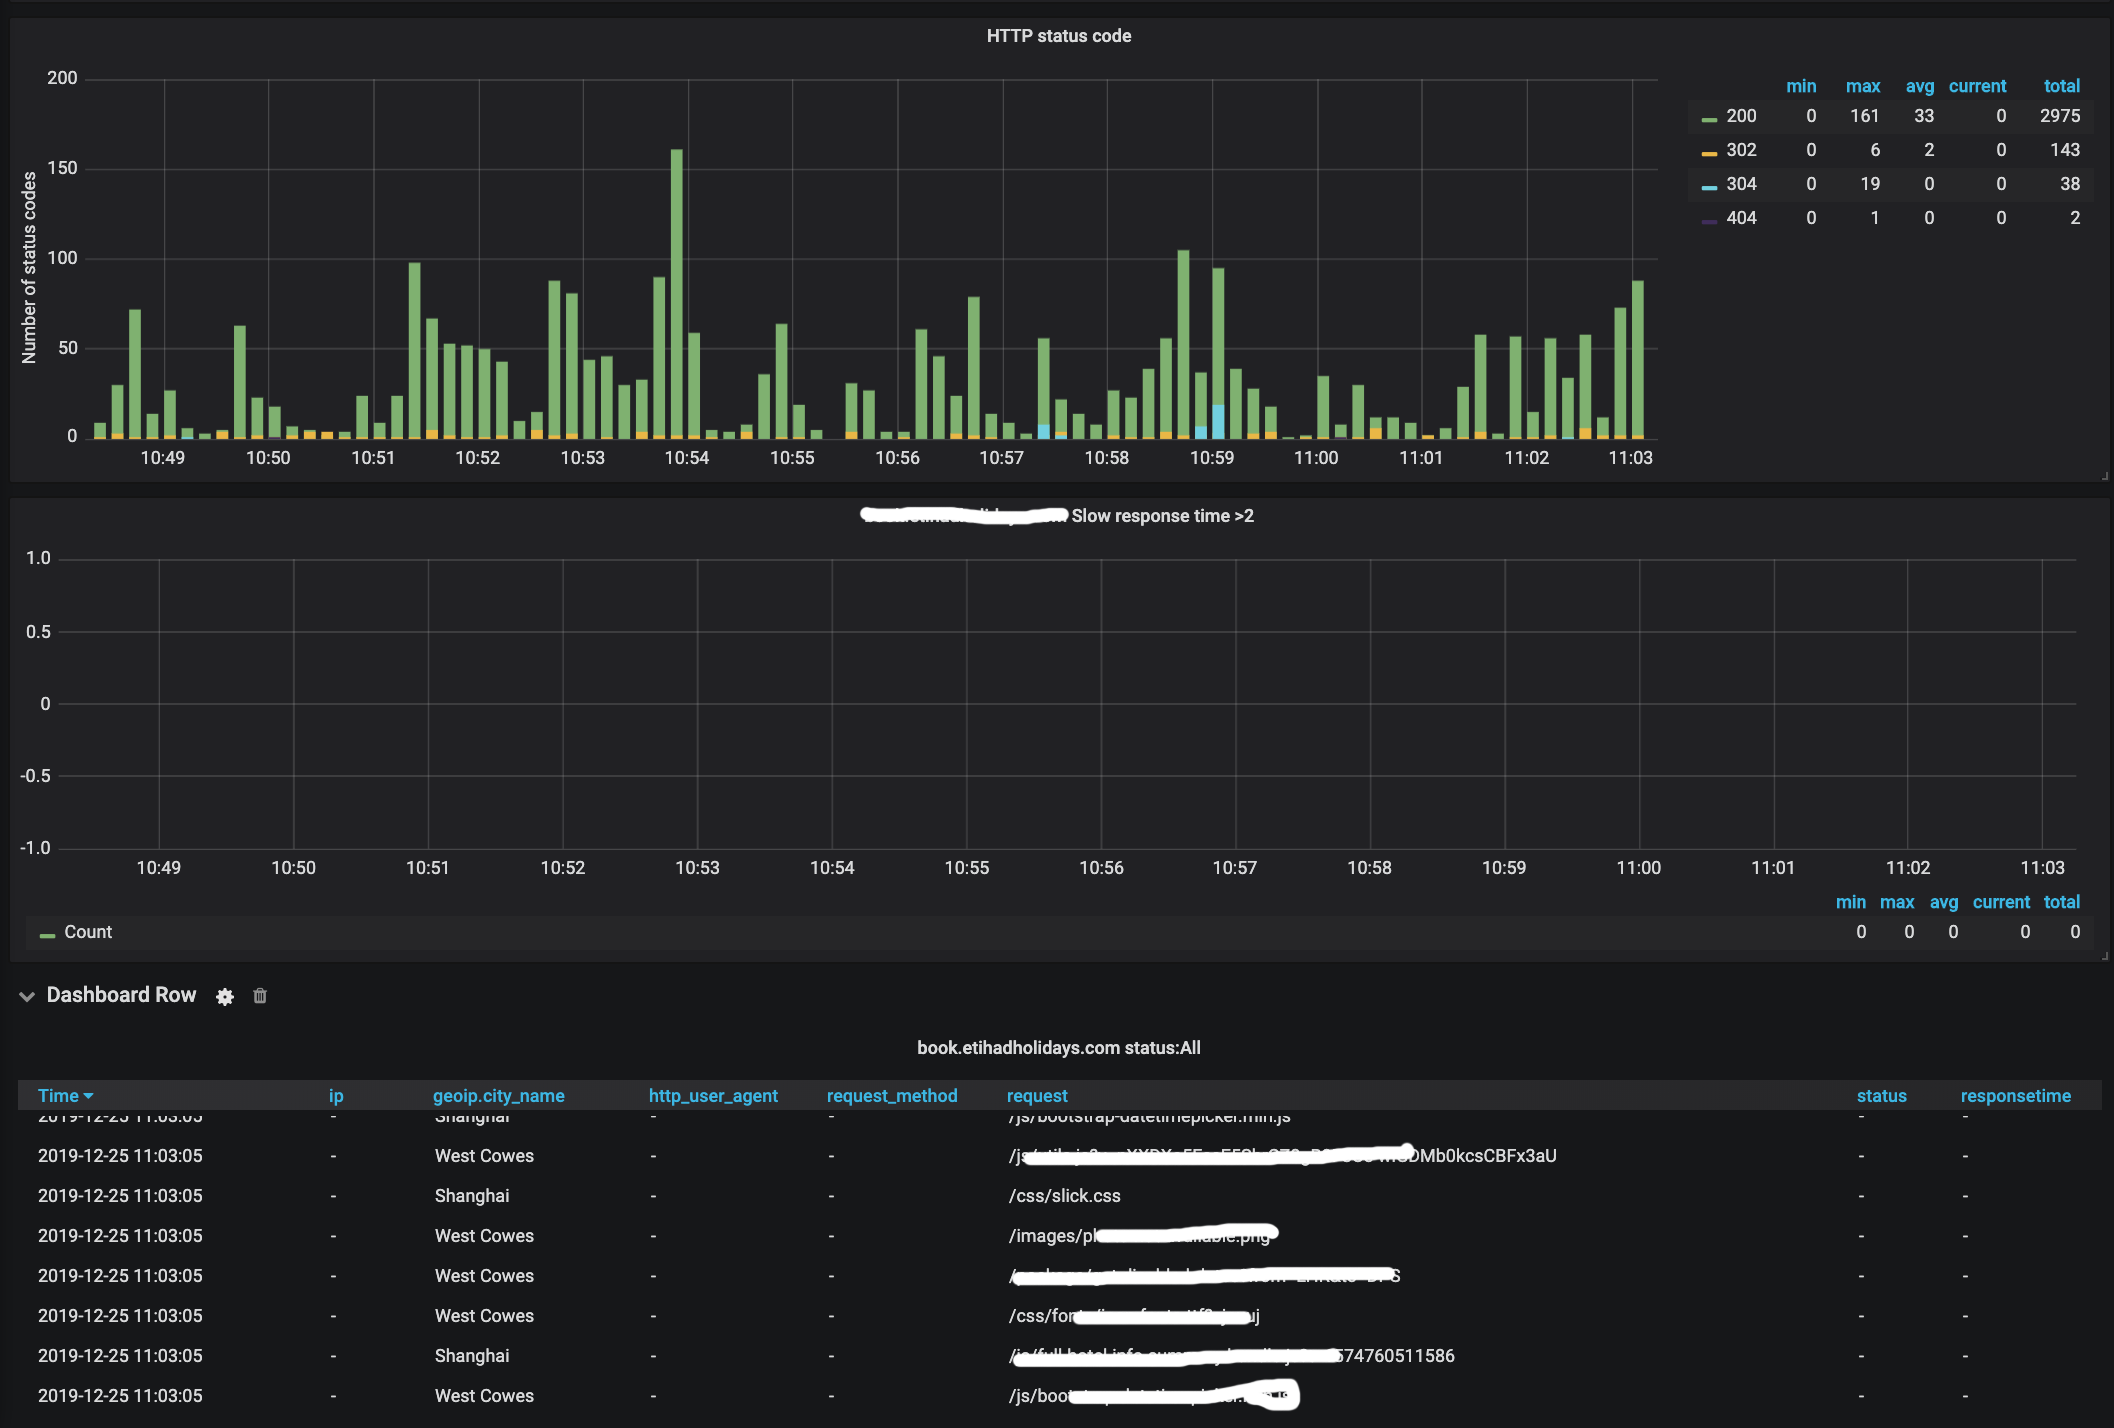
Dashboard for ingress gateway logs uses ElasticSearch, filebeat and logstash. Requirements:
- Elasticsearch 5.x.x or 6.x.x
- Filebeat
- Logstash
Troubleshooting:
If you are facing this error: Error: Missing geohash value grafana elasticsearch
-> Are you using elastic version 6.x.x? I got this error when I used elasticsearch version 6.3.0 and I fixed it by creating a new index with the template below before pushing logs to elasticsearch:
{
    "template": "logstash-*",
    "version": 60001,
    "settings": {
        "index.refresh_interval": "5s"
    },
    "mappings": {
        "_default_": {
            "dynamic_templates": [
                {
                    "message_field": {
                        "path_match": "message",
                        "match_mapping_type": "string",
                        "mapping": {
                            "type": "text",
                            "norms": false
                        }
                    }
                },
                {
                    "string_fields": {
                        "match": "*",
                        "match_mapping_type": "string",
                        "mapping": {
                            "type": "text",
                            "norms": false,
                            "fields": {
                                "keyword": {
                                    "type": "keyword",
                                    "ignore_above": 256
                                }
                            }
                        }
                    }
                }
            ],
            "properties": {
                "@timestamp": {
                    "type": "date"
                },
                "@version": {
                    "type": "keyword"
                },
                "geoip": {
                    "dynamic": true,
                    "properties": {
                        "ip": {
                            "type": "ip"
                        },
                        "location": {
                            "type": "geo_point"
                        },
                        "latitude": {
                            "type": "half_float"
                        },
                        "longitude": {
                            "type": "half_float"
                        }
                    }
                }
            }
        }
    }
}
And I used kubernetes cronjob to create new index automatically. We have sample python code below.
#python3
import requests
import json
import datetime
today = datetime.date.today()
tomorrow = today + datetime.timedelta(days=1)
raw = '{"template":"logstash-","version":60001,"settings":{"index.refresh_interval":"5s"},"mappings":{"default":{"dynamic_templates":[{"message_field":{"path_match":"message","match_mapping_type":"string","mapping":{"type":"text","norms":false}}},{"string_fields":{"match":"","match_mapping_type":"string","mapping":{"type":"text","norms":false,"fields":{"keyword":{"type":"keyword","ignore_above":256}}}}}],"properties":{"@timestamp":{"type":"date"},"@version":{"type":"keyword"},"geoip":{"dynamic":true,"properties":{"ip":{"type":"ip"},"location":{"type":"geo_point"},"latitude":{"type":"half_float"},"longitude":{"type":"half_float"}}}}}}}'
data = json.loads(raw)
create_index = requests.put('http://elasticsearch-client:9200/logstash-{}'.format(tomorrow.strftime('%Y.%m.%d')), json=data)
cronjob.yml
apiVersion: batch/v1beta1
kind: CronJob
metadata:
  name: elk-automation
spec:
  schedule: "0 2 * * *"
  jobTemplate:
    spec:
      template:
        spec:
          containers:
          - name: elk-automation
            image: <your image>
          restartPolicy: Never
Link github sample code: https://github.com/khainguyen95/elasticsearch-template
Data source config
Collector config:
Upload an updated version of an exported dashboard.json file from Grafana
| Revision | Description | Created | |
|---|---|---|---|
| Download |
Elasticsearch
Easily monitor Elasticsearch, a distributed, multitenant full-text search engine, with Grafana Cloud's out-of-the-box monitoring solution.
Learn more