Prometheus Internal Stats
Extending the default Prometheus 2.0 dashboard with more debug-relevant metrics.
Prometheus Internal Stats
Extending the default dashboard with more debug-relevant metrics.
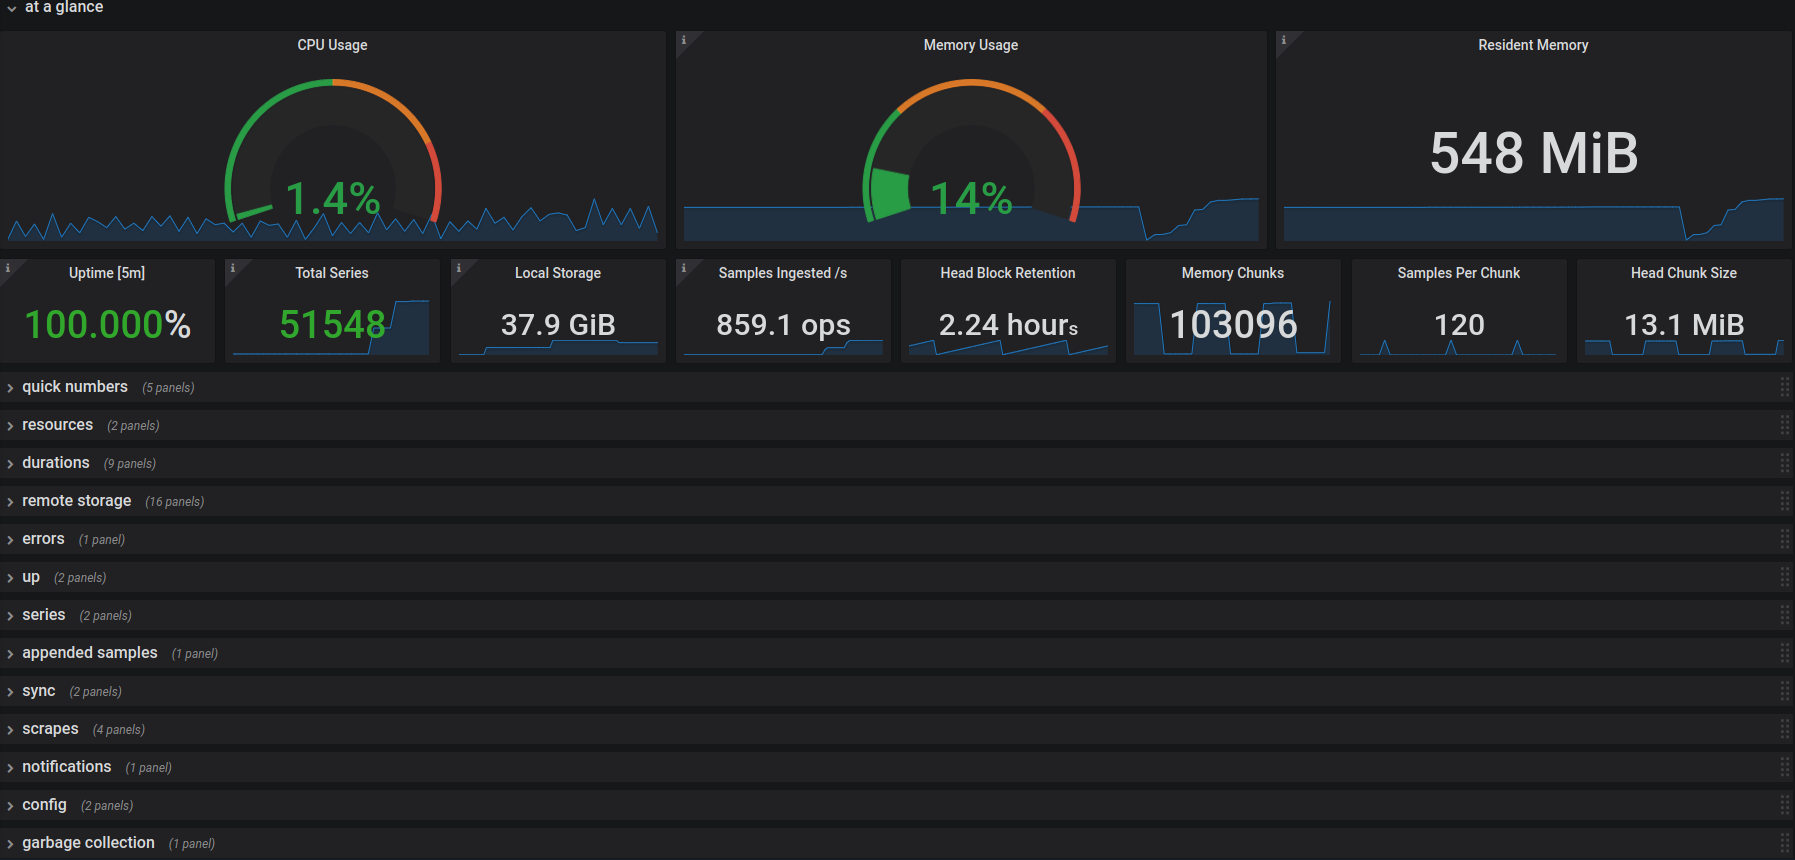
Shows metrics about:
- Resources
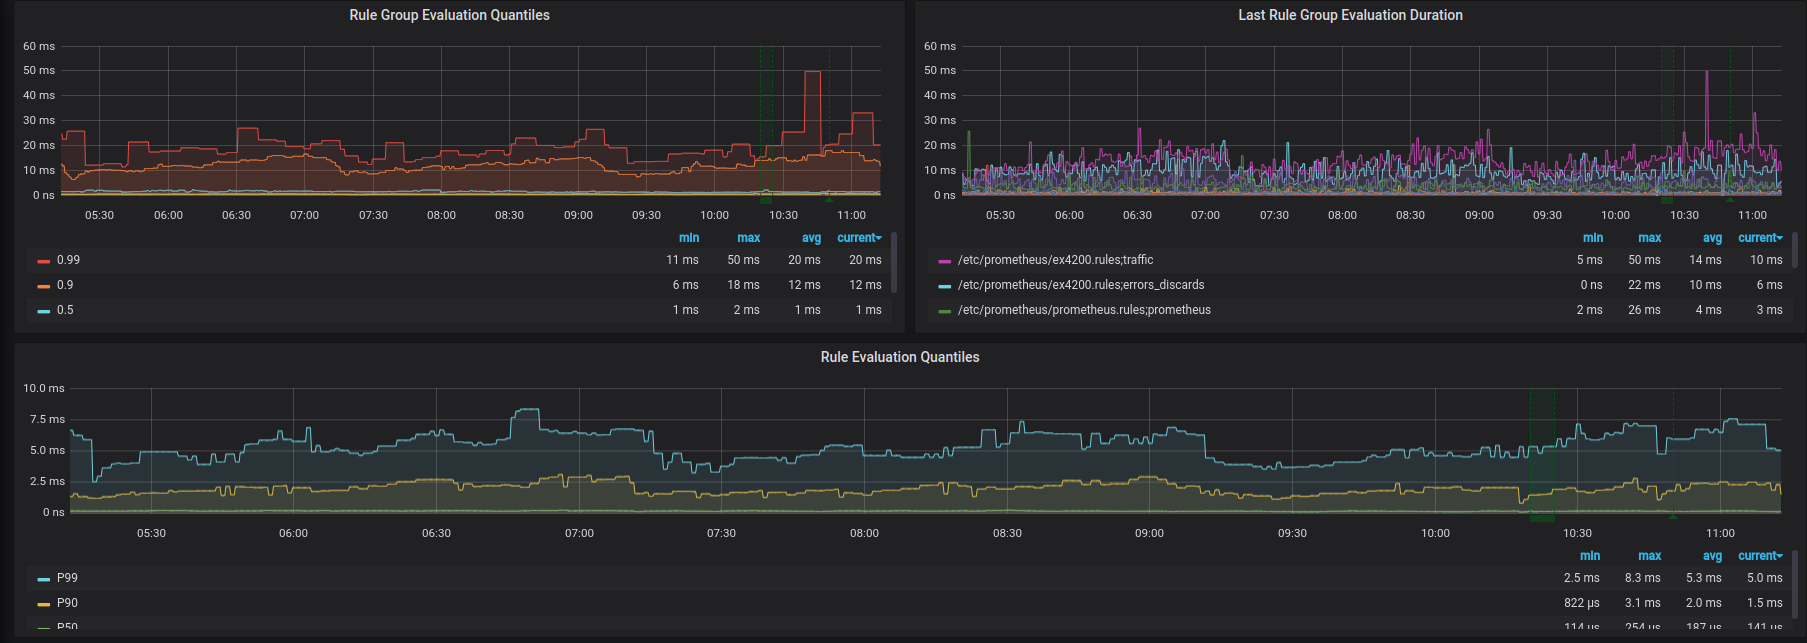
- Rule durations
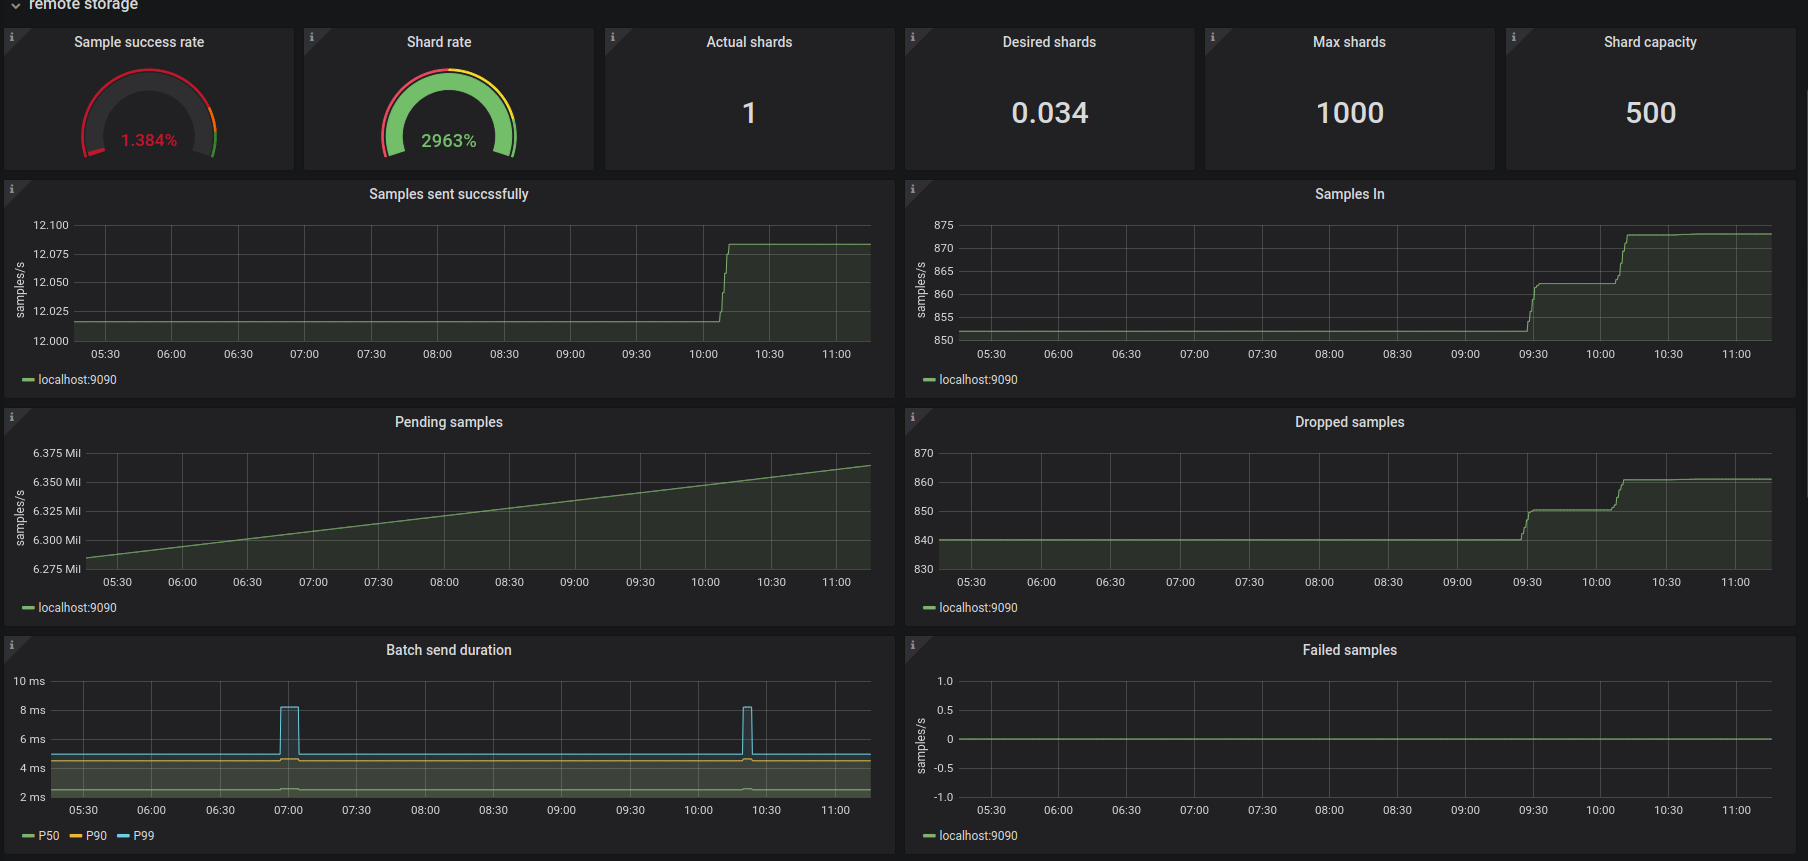
- Remote storage
- Errors
- Samples
- Sync
- Scrapes
- Notifications
- Config
- GC
Data source config
Collector type:
Collector plugins:
Collector config:
Revisions
Upload an updated version of an exported dashboard.json file from Grafana
| Revision | Description | Created | |
|---|---|---|---|
| Download |
Metrics Endpoint (Prometheus)
Easily monitor any Prometheus-compatible and publicly accessible metrics URL with Grafana Cloud's out-of-the-box monitoring solution.
Learn more