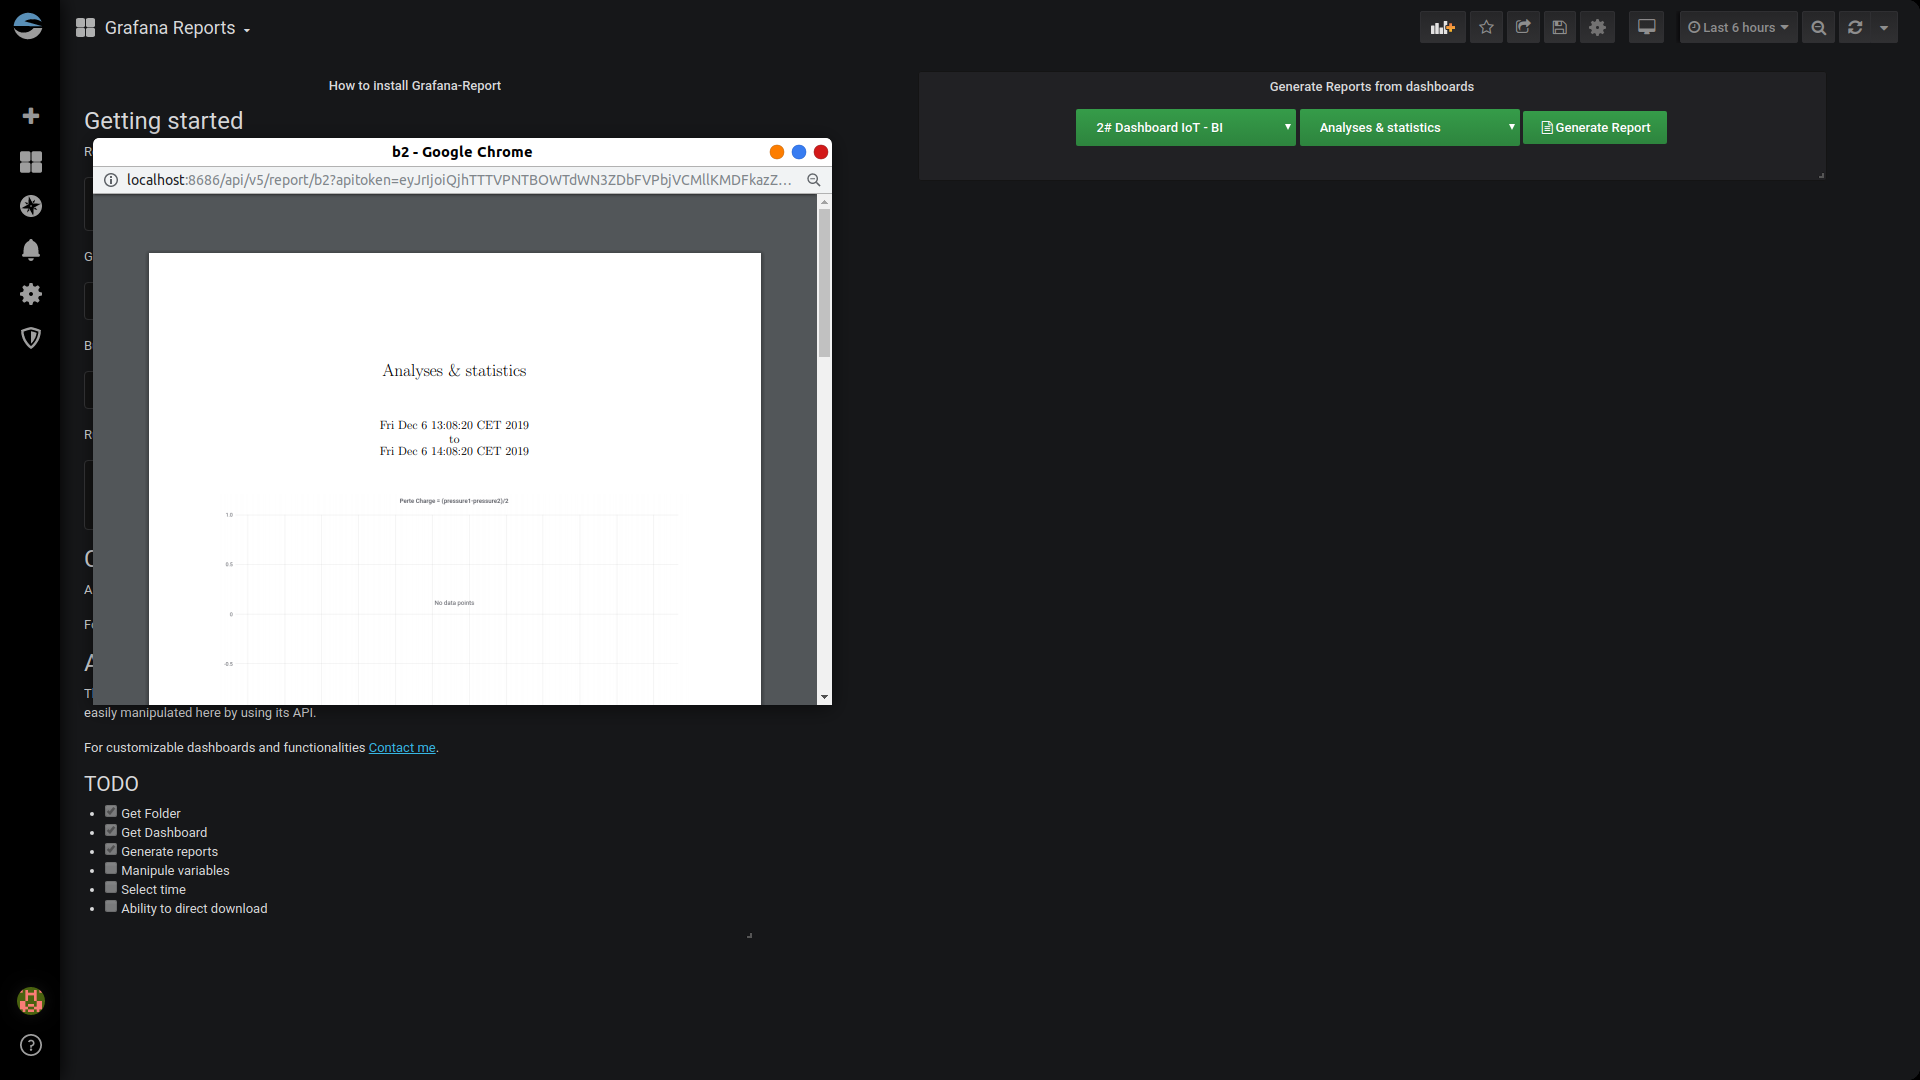
Grafana Reports
This dashboard contains a panel that allows you to faster generate reports from dashboards.
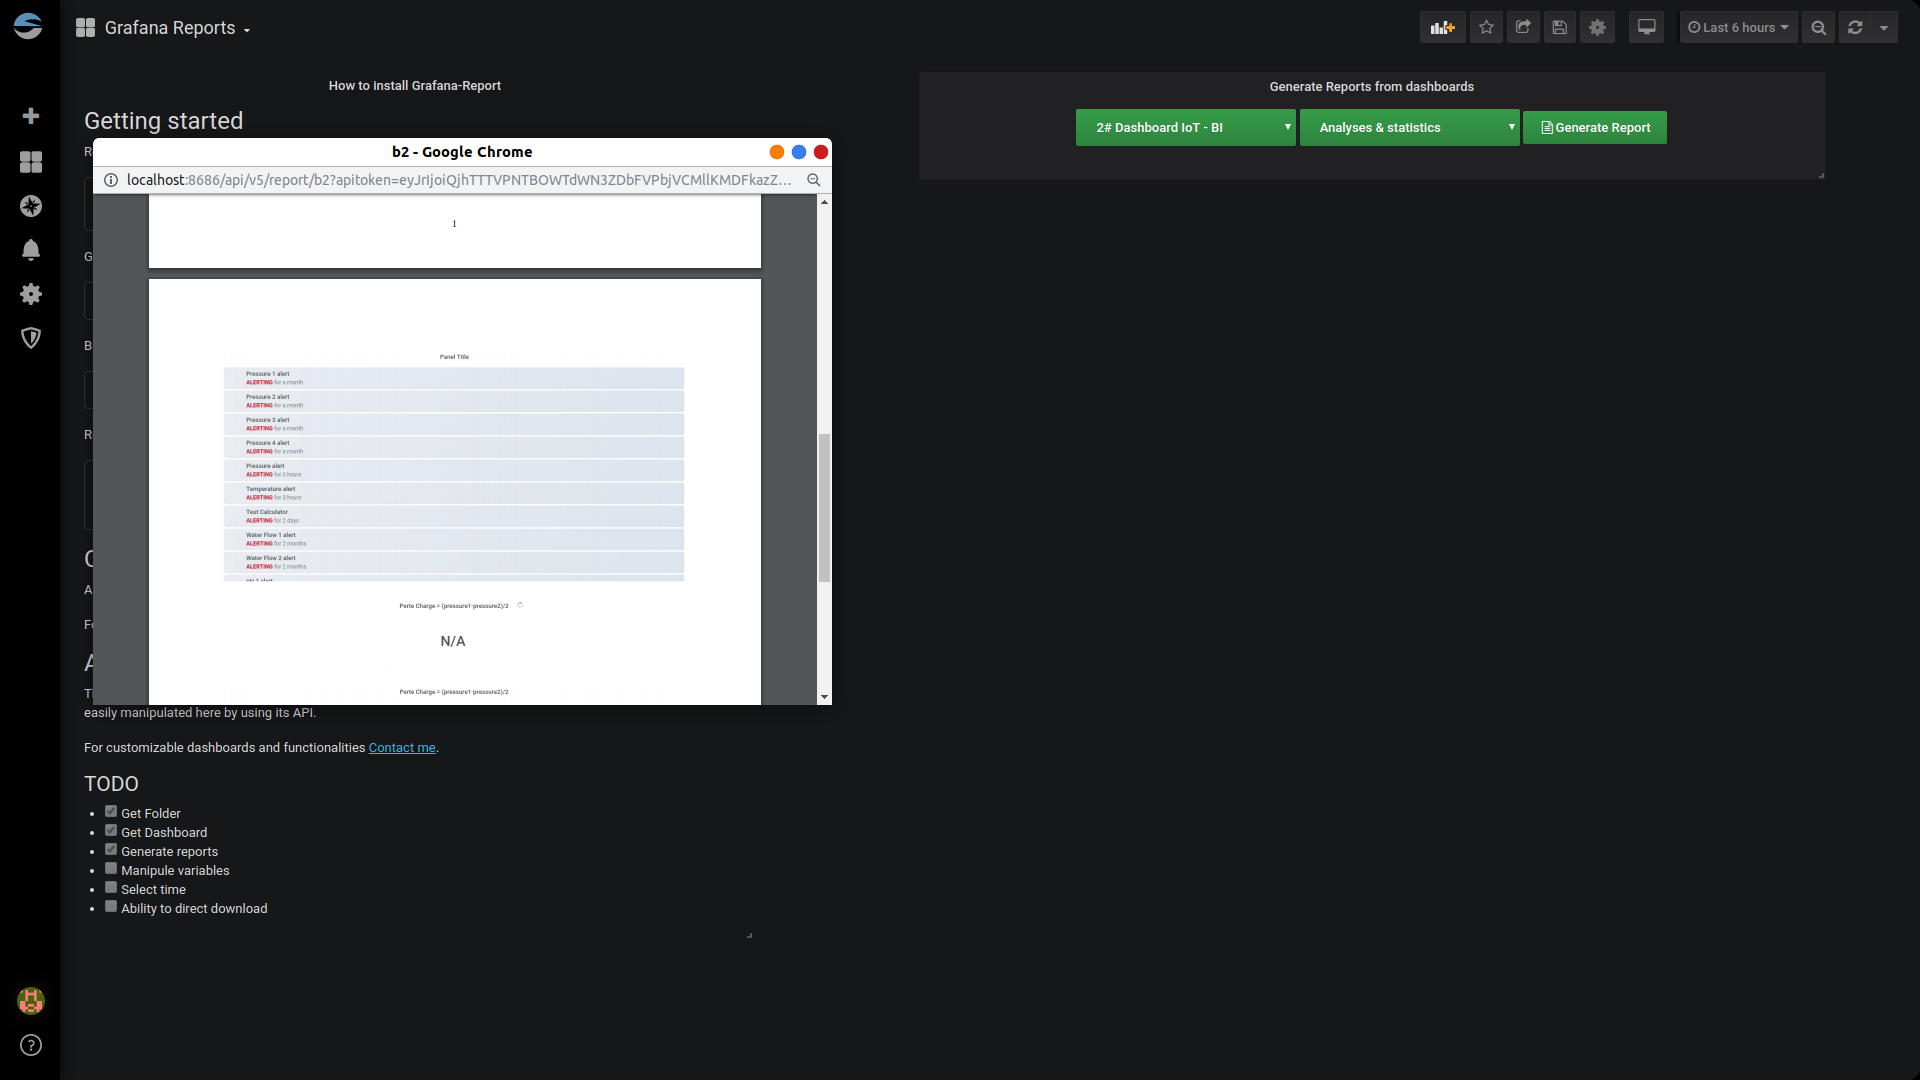
Getting started
Requirements:
apt install golang-go
apt install texlive-latex-base
Get the source files and dependencies:
go get github.com/IzakMarais/reporter/...
Build and install grafana-reporter binary:
go install -v github.com/IzakMarais/reporter/cmd/grafana-reporter
Running without any flags assumes Grafana is reachable at localhost:3000:
export GOPATH=$HOME/go
export PATH=$PATH:$GOROOT/bin:$GOPATH/bin
grafana-reporter
Credits
All thanks goes to IzakMarais who made the Service that generates a PDF report from a Grafana dashboard.
For more info browse his github Repository.
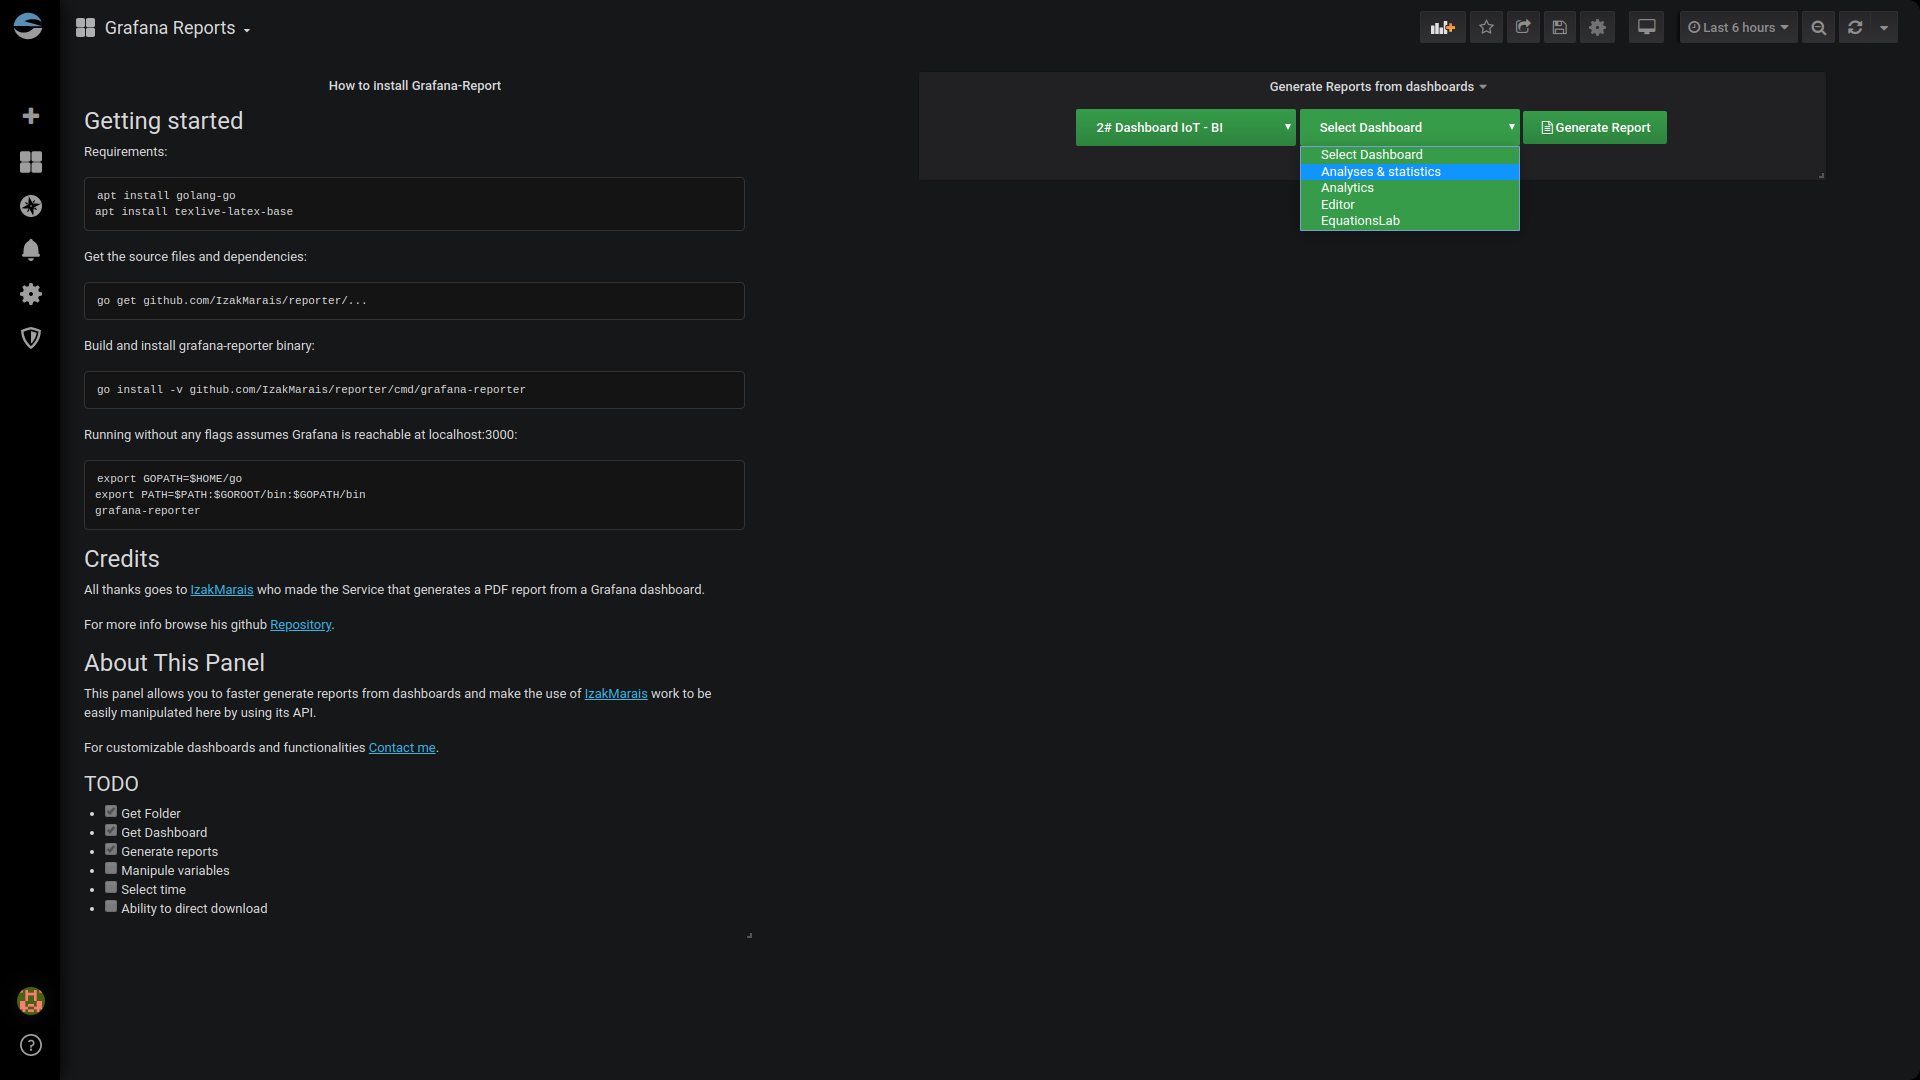
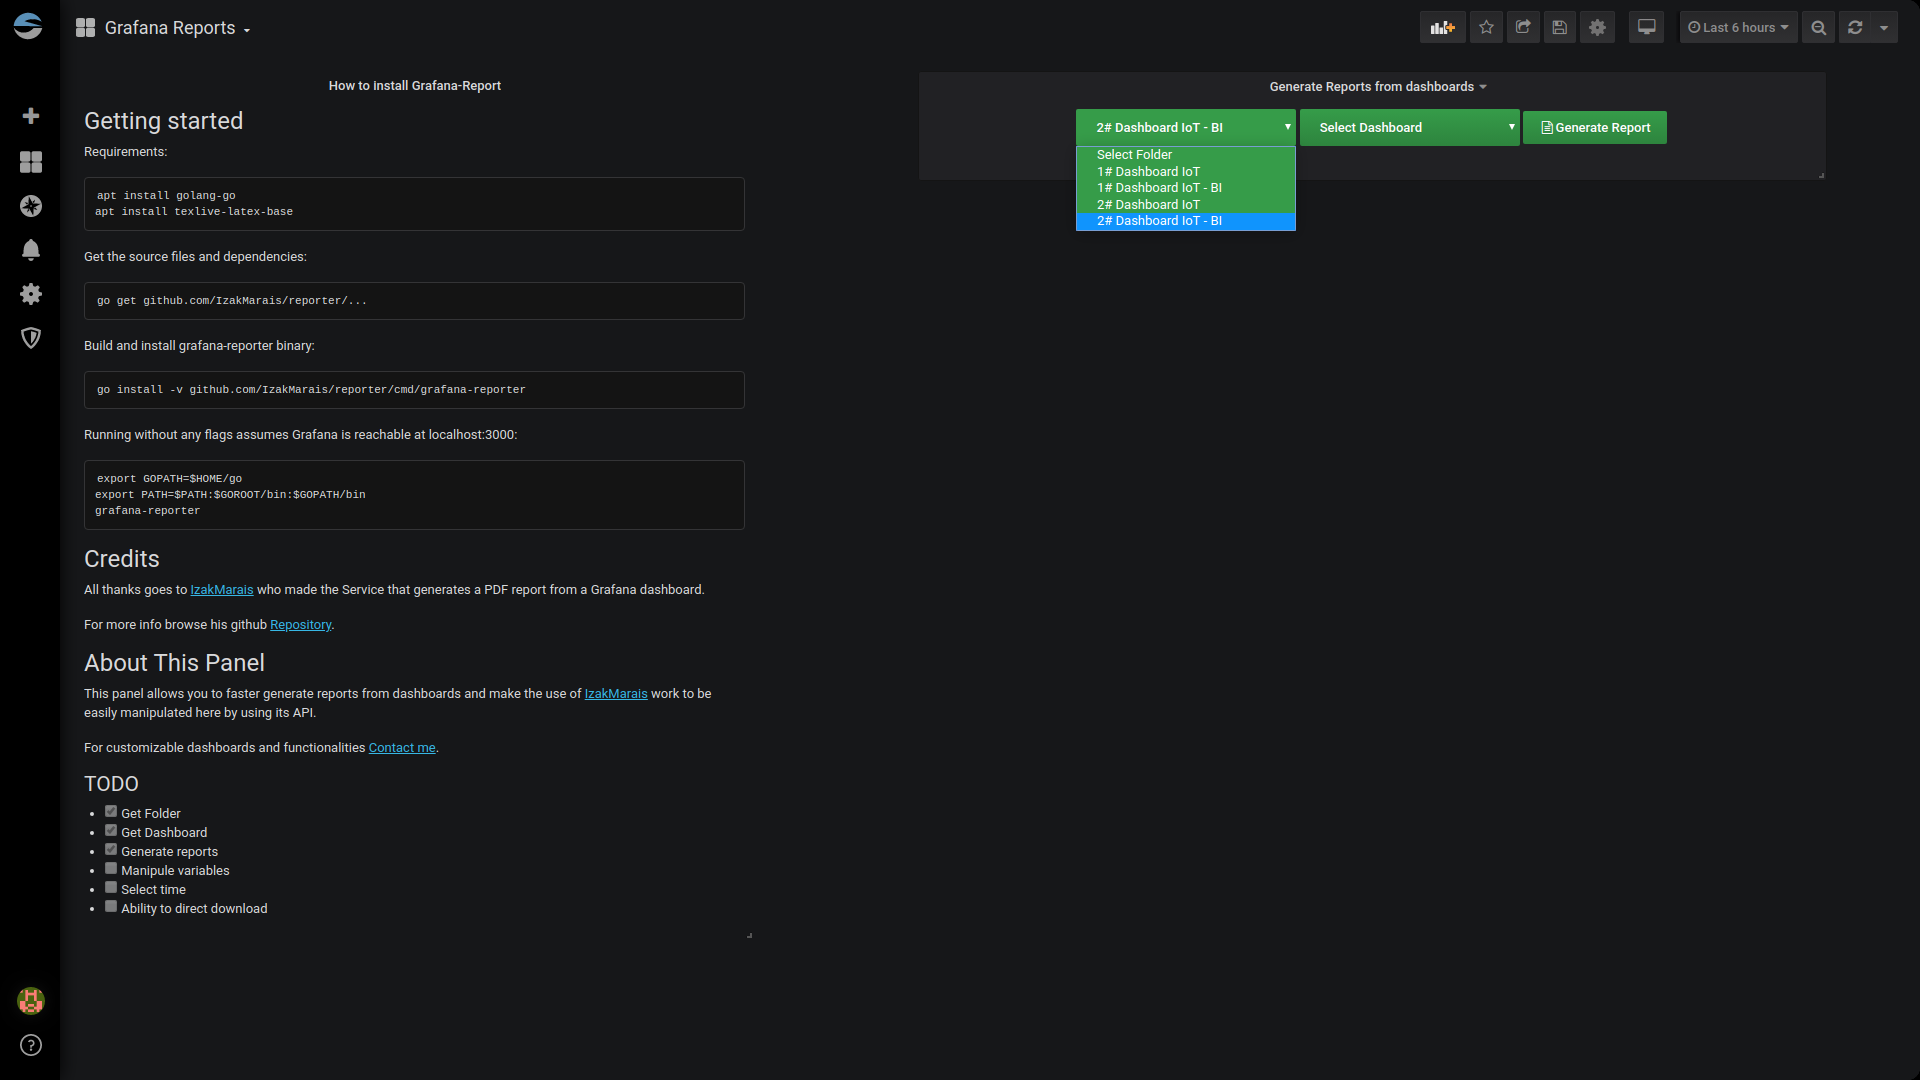
About This Panel
This panel allows you to faster generate reports from dashboards and make the use of IzakMarais work to be easily manipulated here by using its API.
For customizable dashboards and functionalities Contact me.
And yes, do not forget to review.
TODO
- Get Folder.
- Get Dashboard.
- Generate reports.
- [O] Manipule variables.
- [O] Select time.
- [O] Ability to direct download.

Data source config
Collector type:
Collector plugins:
Collector config:
Revisions
Upload an updated version of an exported dashboard.json file from Grafana
| Revision | Description | Created | |
|---|---|---|---|
| Download |