Kubernetes Cluster Dashboard
This dashboard gives an overall view of the cluster compute resources.
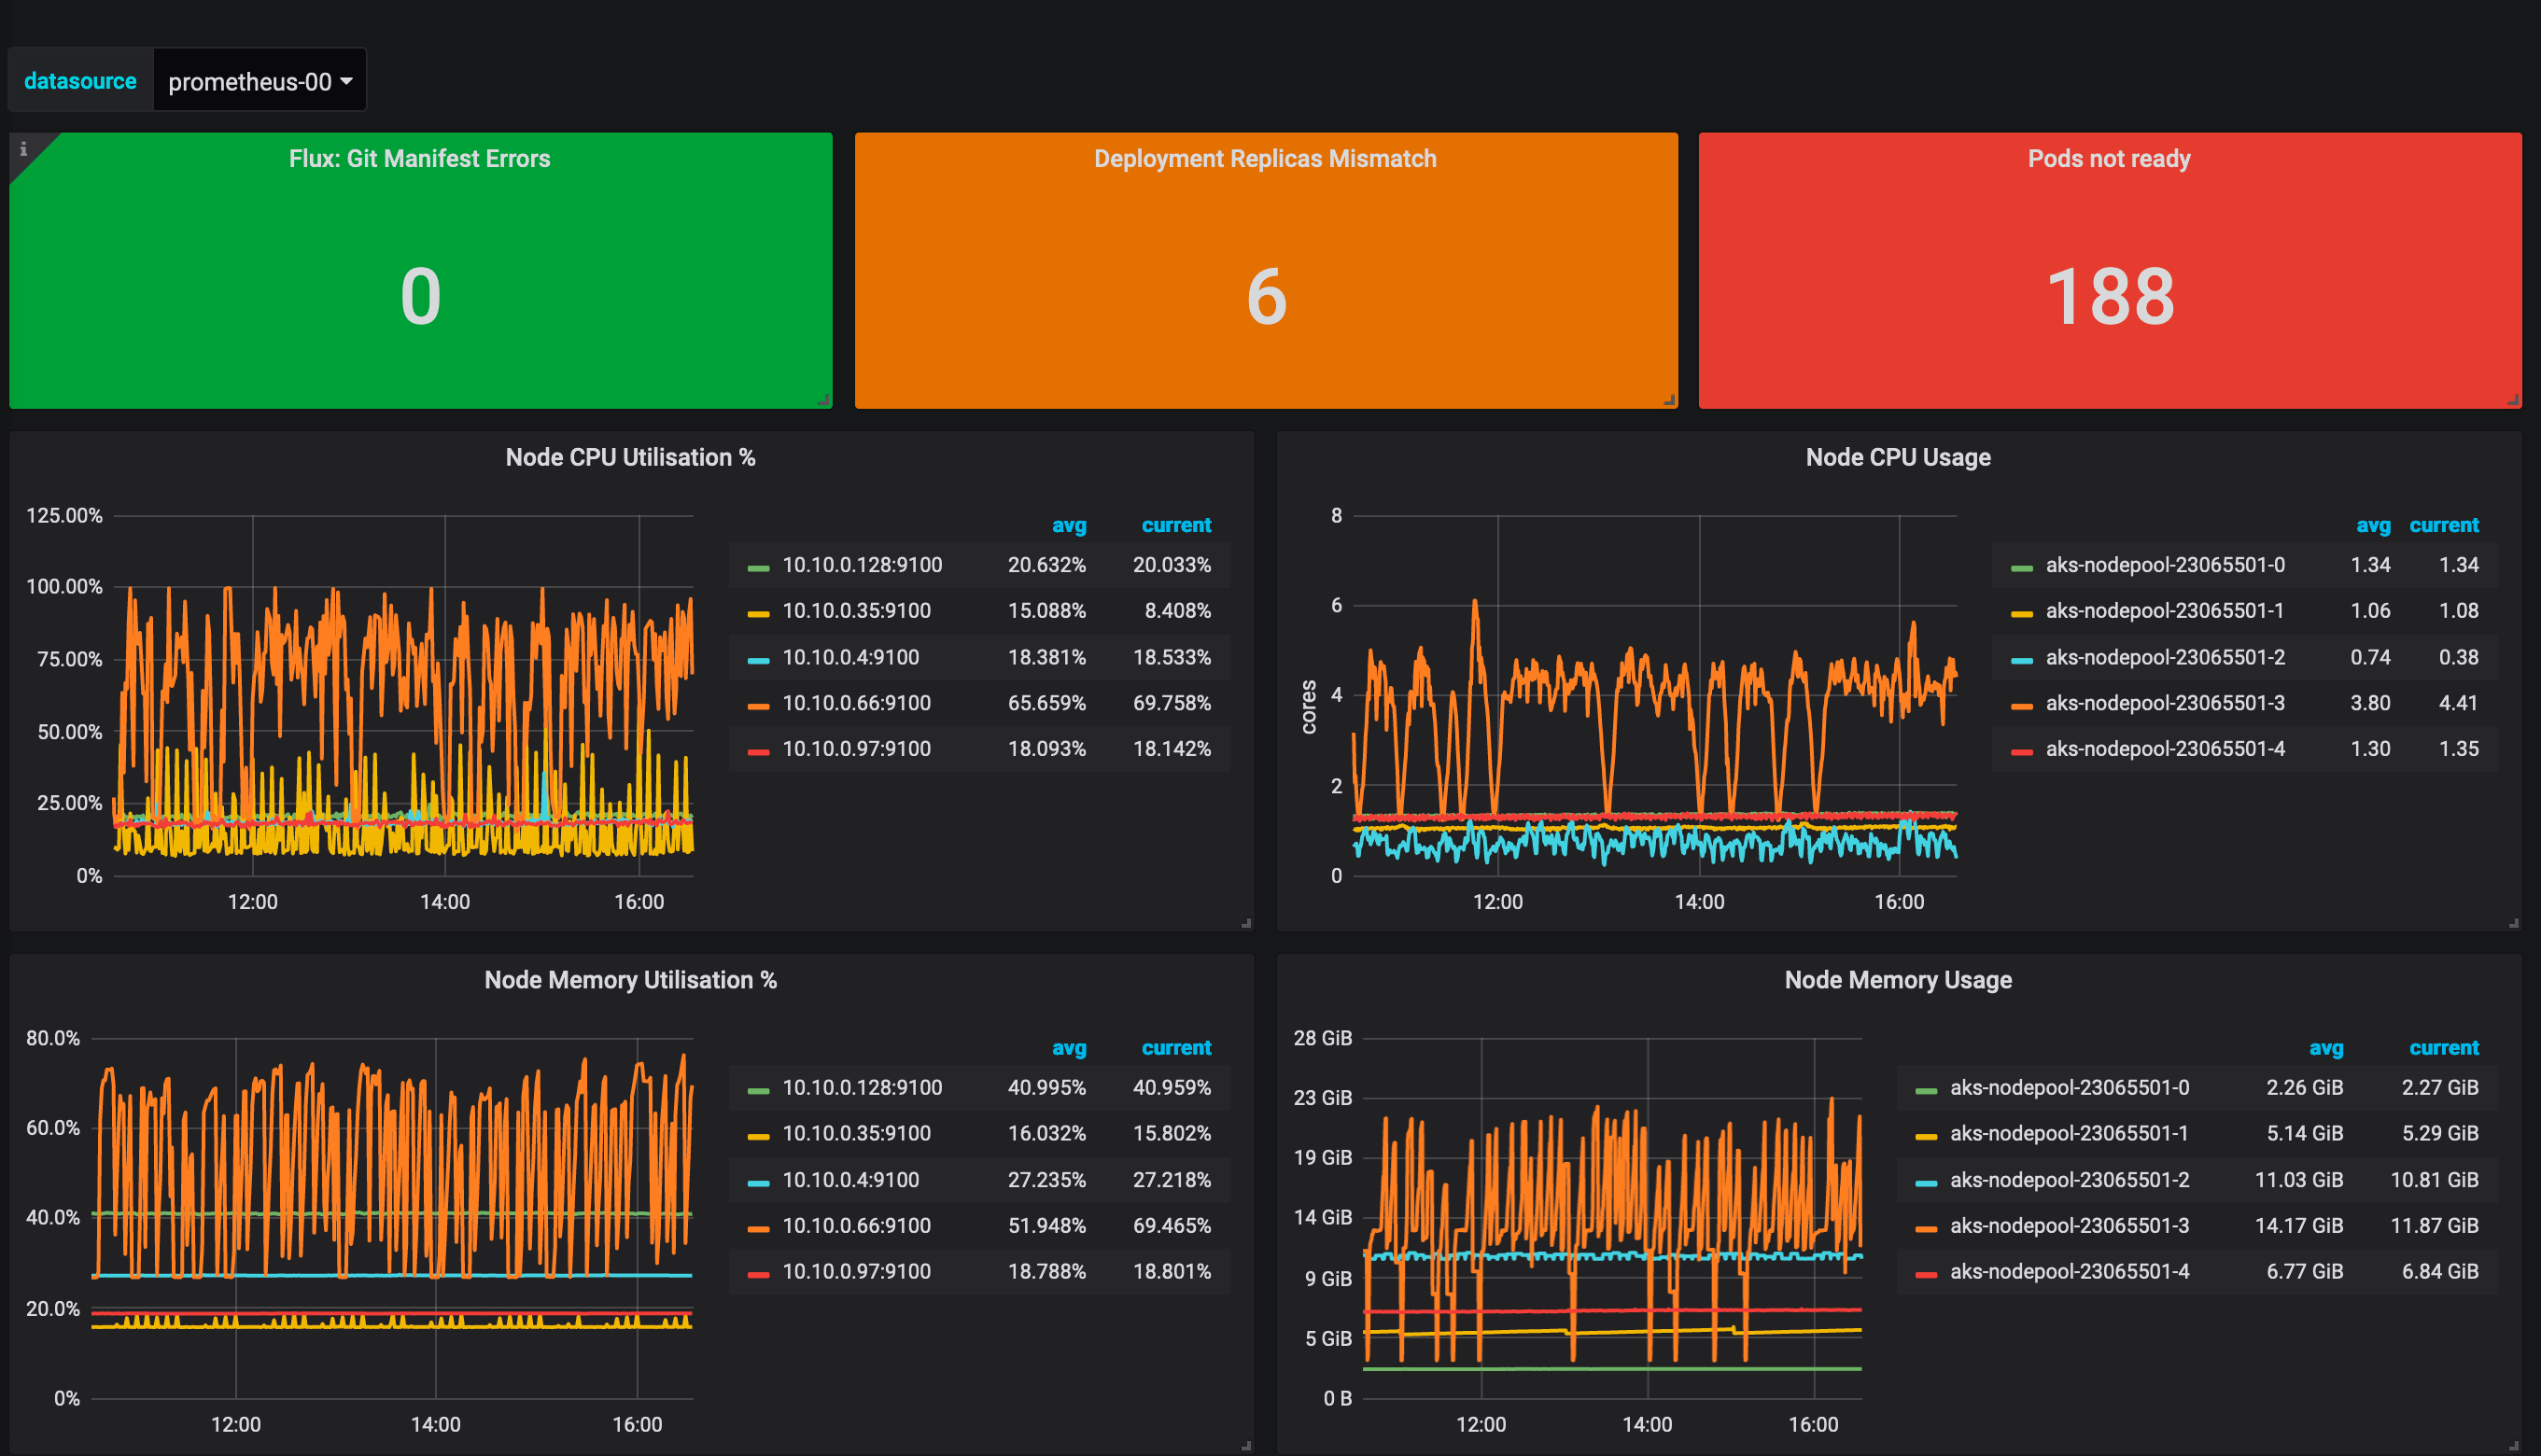
This dashboard collects data from the Prometheus Datasource. It has been tested with an installation of the Prometheus Operator project. It also requires Flux to be used by the cluster in a GitOps deployment model and the respective prometheus metrics to be scrapped.
Data source config
Collector type:
Collector plugins:
Collector config:
Revisions
Upload an updated version of an exported dashboard.json file from Grafana
| Revision | Description | Created | |
|---|---|---|---|
| Download |
Kubernetes
Monitor your Kubernetes deployment with prebuilt visualizations that allow you to drill down from a high-level cluster overview to pod-specific details in minutes.
Learn more