
Erlang-Memory-Allocators
Erlang VM memory utilisation from erts_alloc perspective
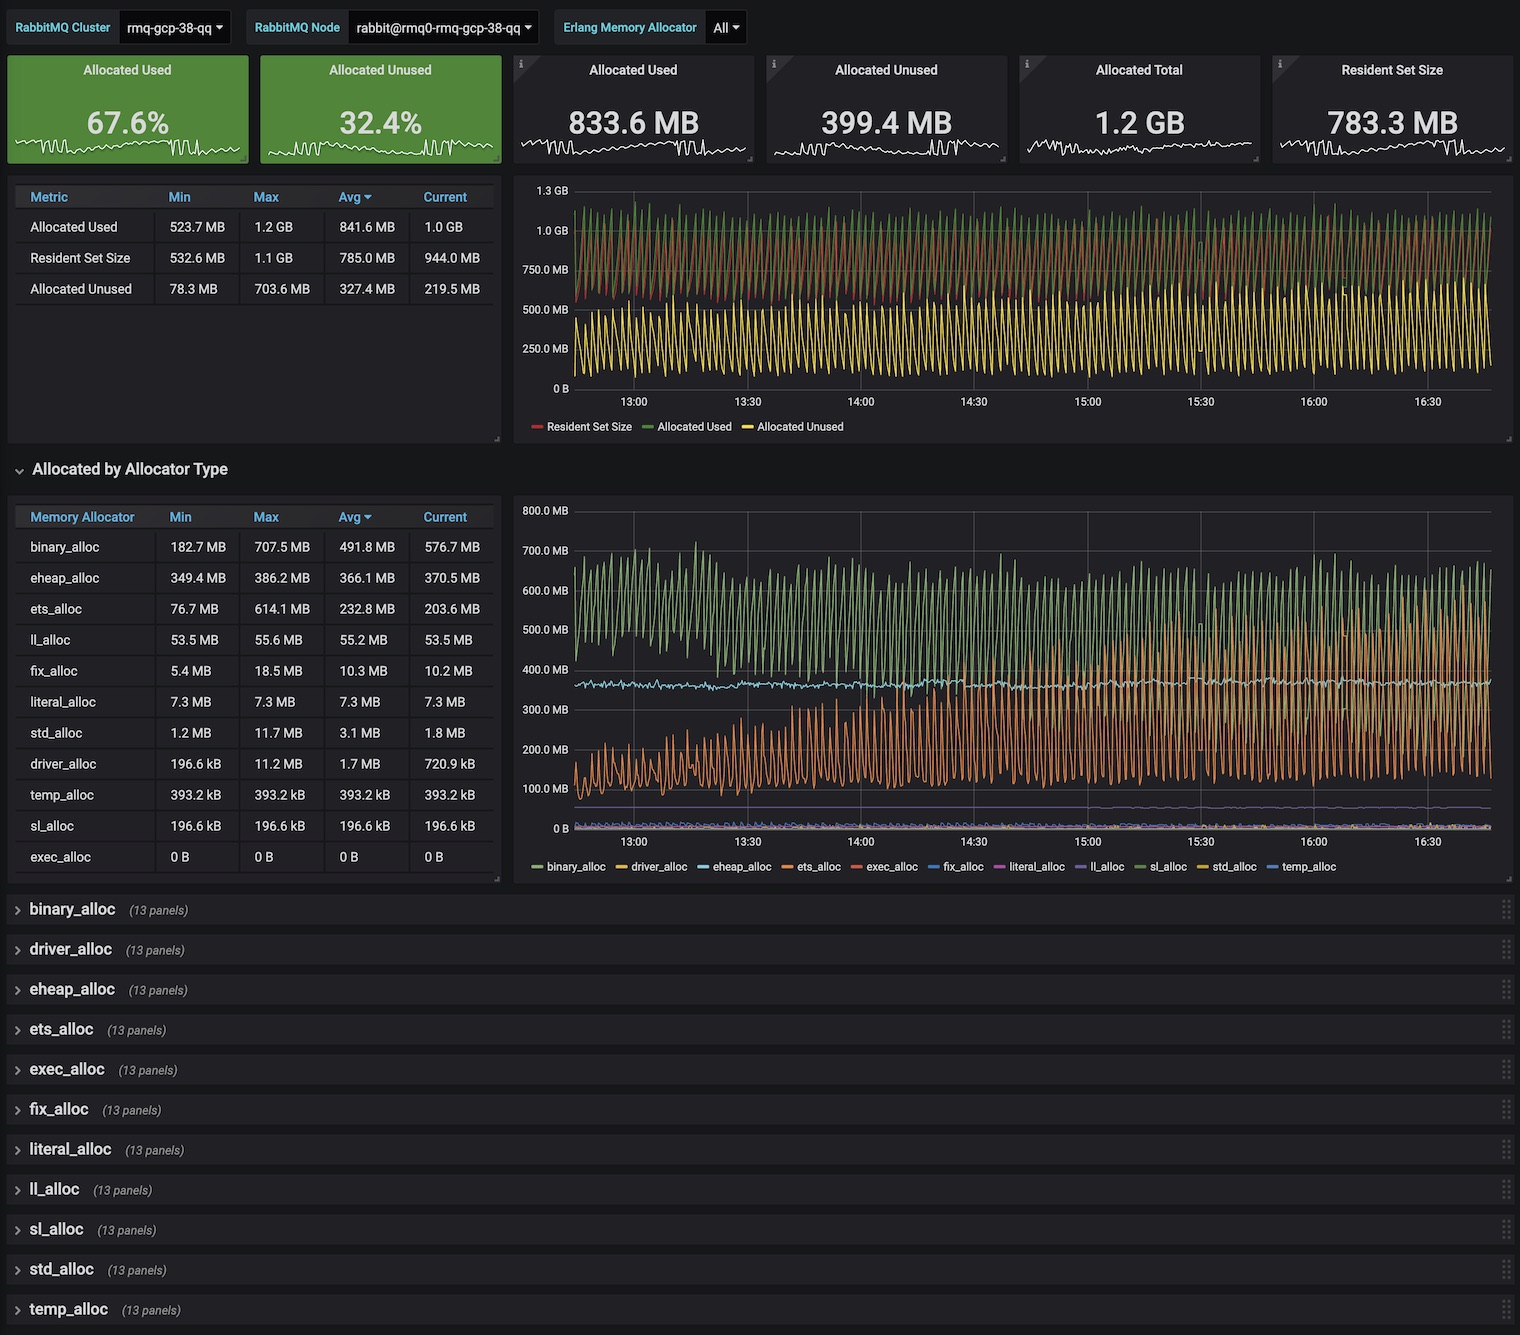
Understand Erlang VM memory breakdown across all allocators & schedulers.
Metrics displayed:
Resident Set Size - as captured by
rabbitmq_process_resident_memory_bytesAllocated
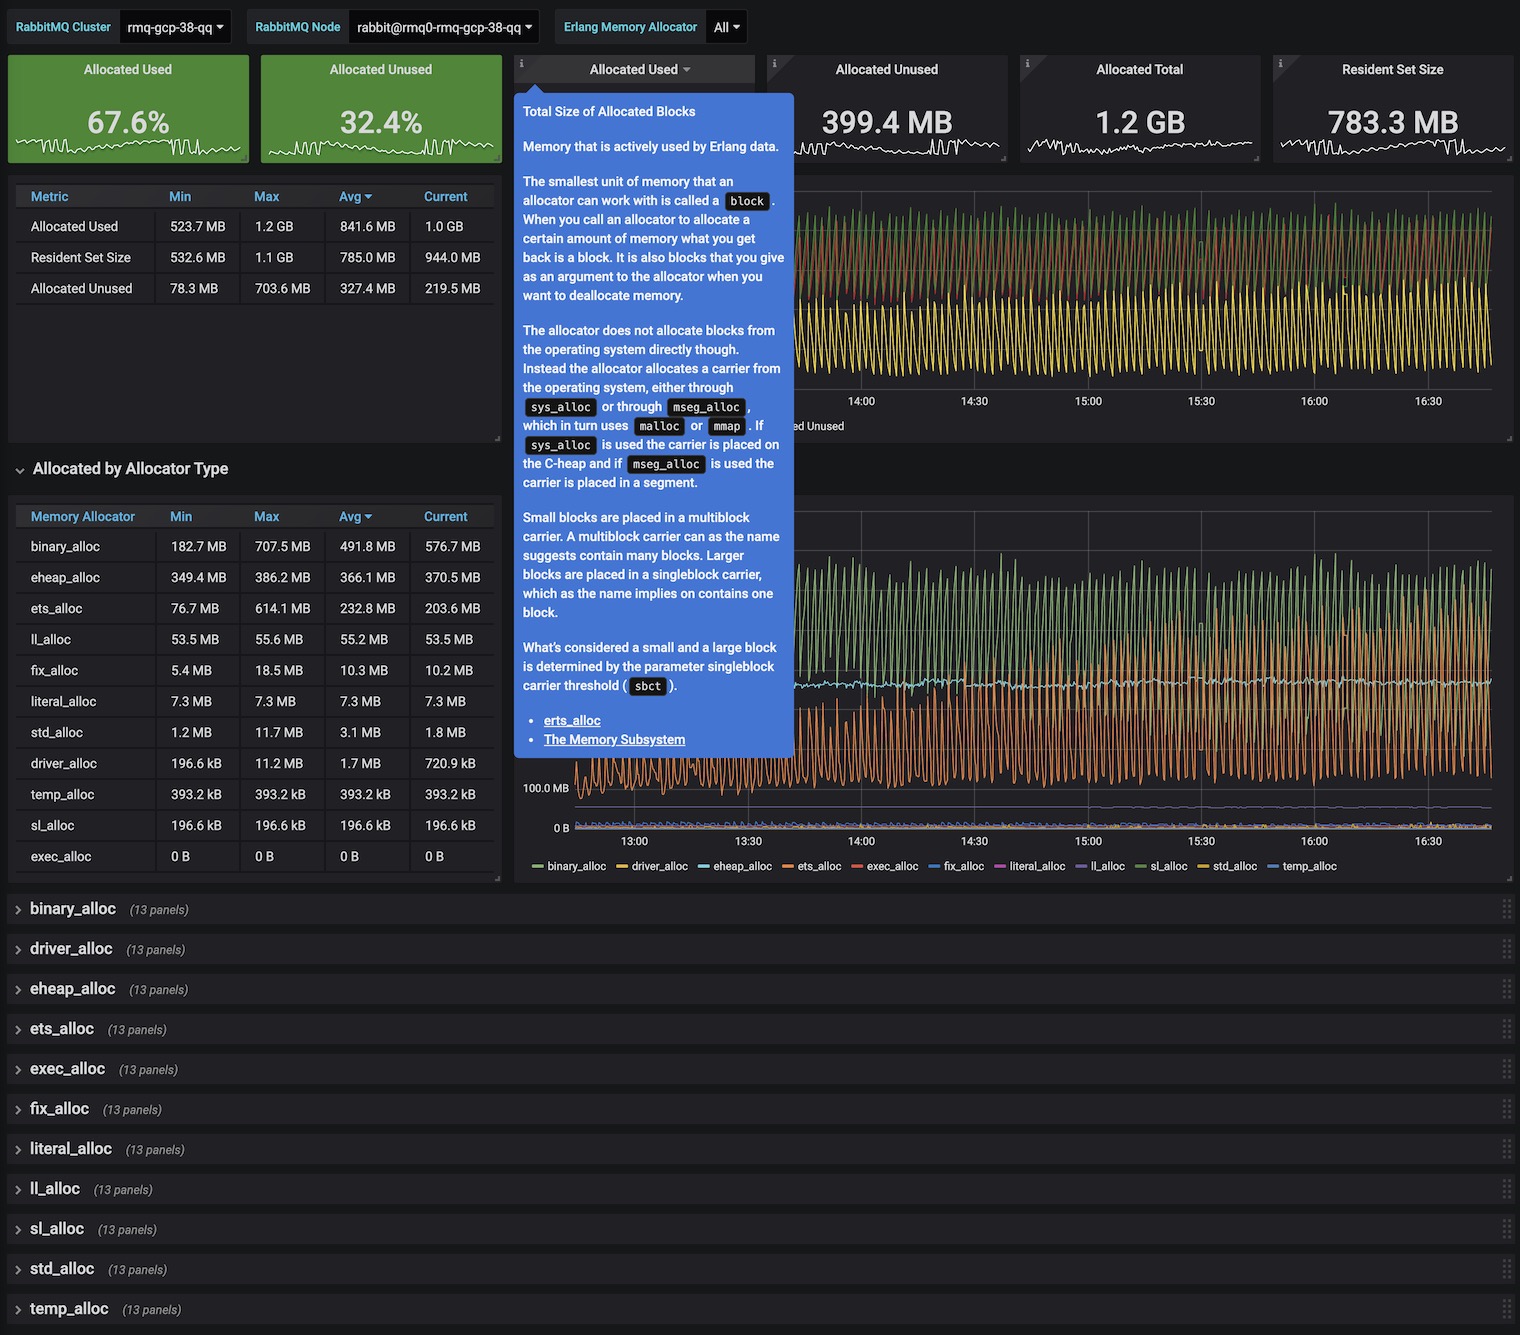
- Total
- Used
- Unused
Allocated by Allocator Type (Min / Max / Avg / Current)
- binary_alloc
- driver_alloc
- eheap_alloc
- ets_alloc
- exec_alloc
- fix_alloc
- literal_alloc
- ll_alloc
- sl_alloc
- std_alloc
- temp_alloc
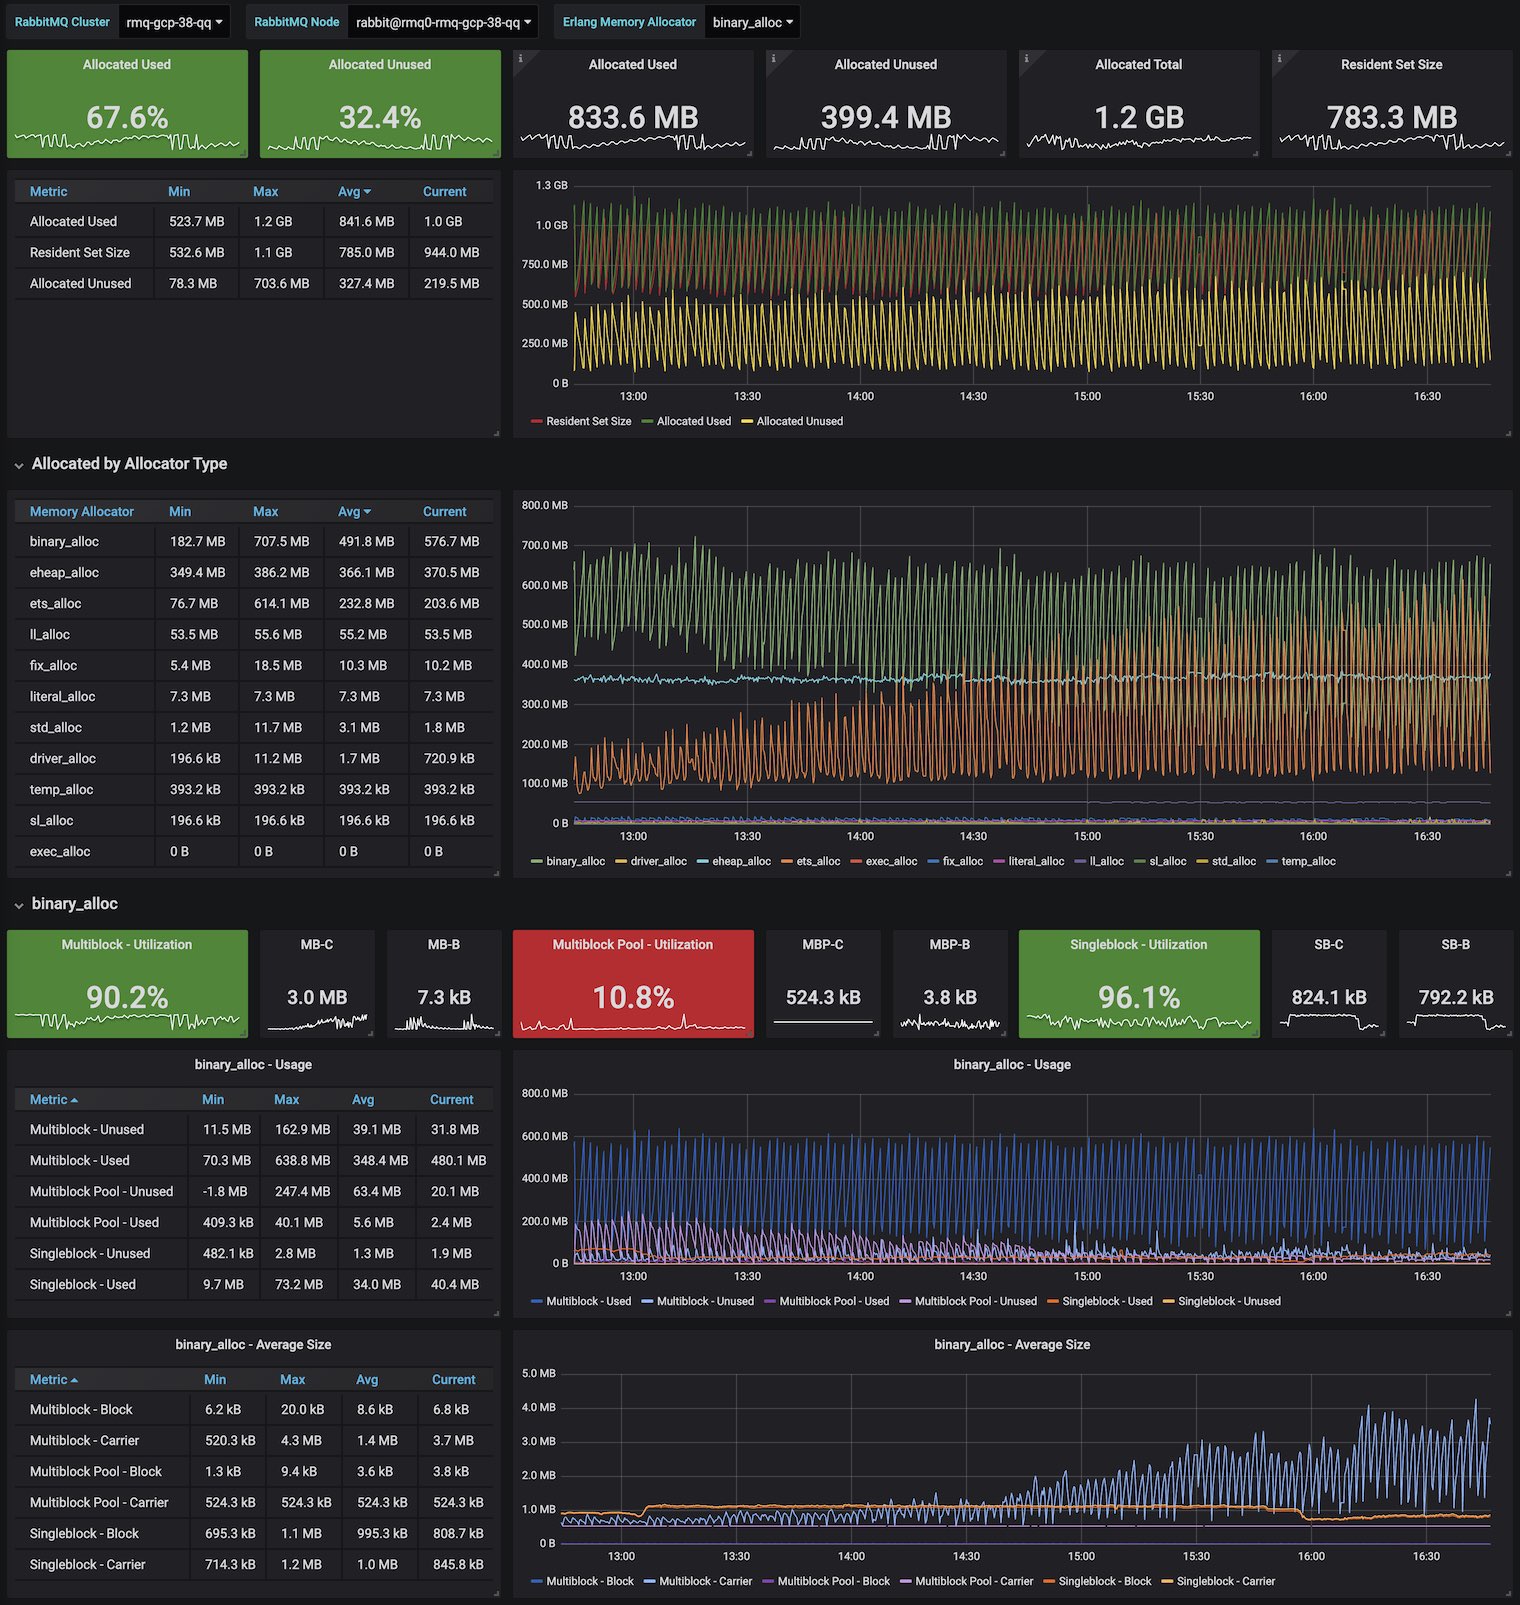
For each allocator type:
Multiblock
- Used
- Block
- Carrier
- Unused
- Used
Multiblock Pool
- Used
- Block
- Carrier
- Unused
- Used
Singleblock
- Used
- Block
- Carrier
- Unused
- Used
Filter by:
- RabbitMQ Cluster
- RabbitMQ Node
- Erlang Memory Allocator (Multi-value + All)
Depends on rabbitmq-prometheus plugin, built-in since RabbitMQ v3.8.0
Learn more about RabbitMQ built-in Prometheus support
To get it working locally with RabbitMQ in 3 simple steps, follow this Quick Start guide
Data source config
Collector type:
Collector plugins:
Collector config:
Dashboard revisions
Upload an updated version of an exported dashboard.json file from Grafana
| Revision | Decscription | Created | |
|---|---|---|---|
| Download |
Sign up for Grafana Cloud

Get up and running in minutes with the Grafana Cloud free tier, which includes free forever 10k metrics, 50GB logs, 50GB traces, 500 VUh, and more.
Get this dashboard
Data source:
Dependencies: