RabbitMQ-Quorum-Queues-Raft
Raft state for all Quorum Queues running in a RabbitMQ cluster
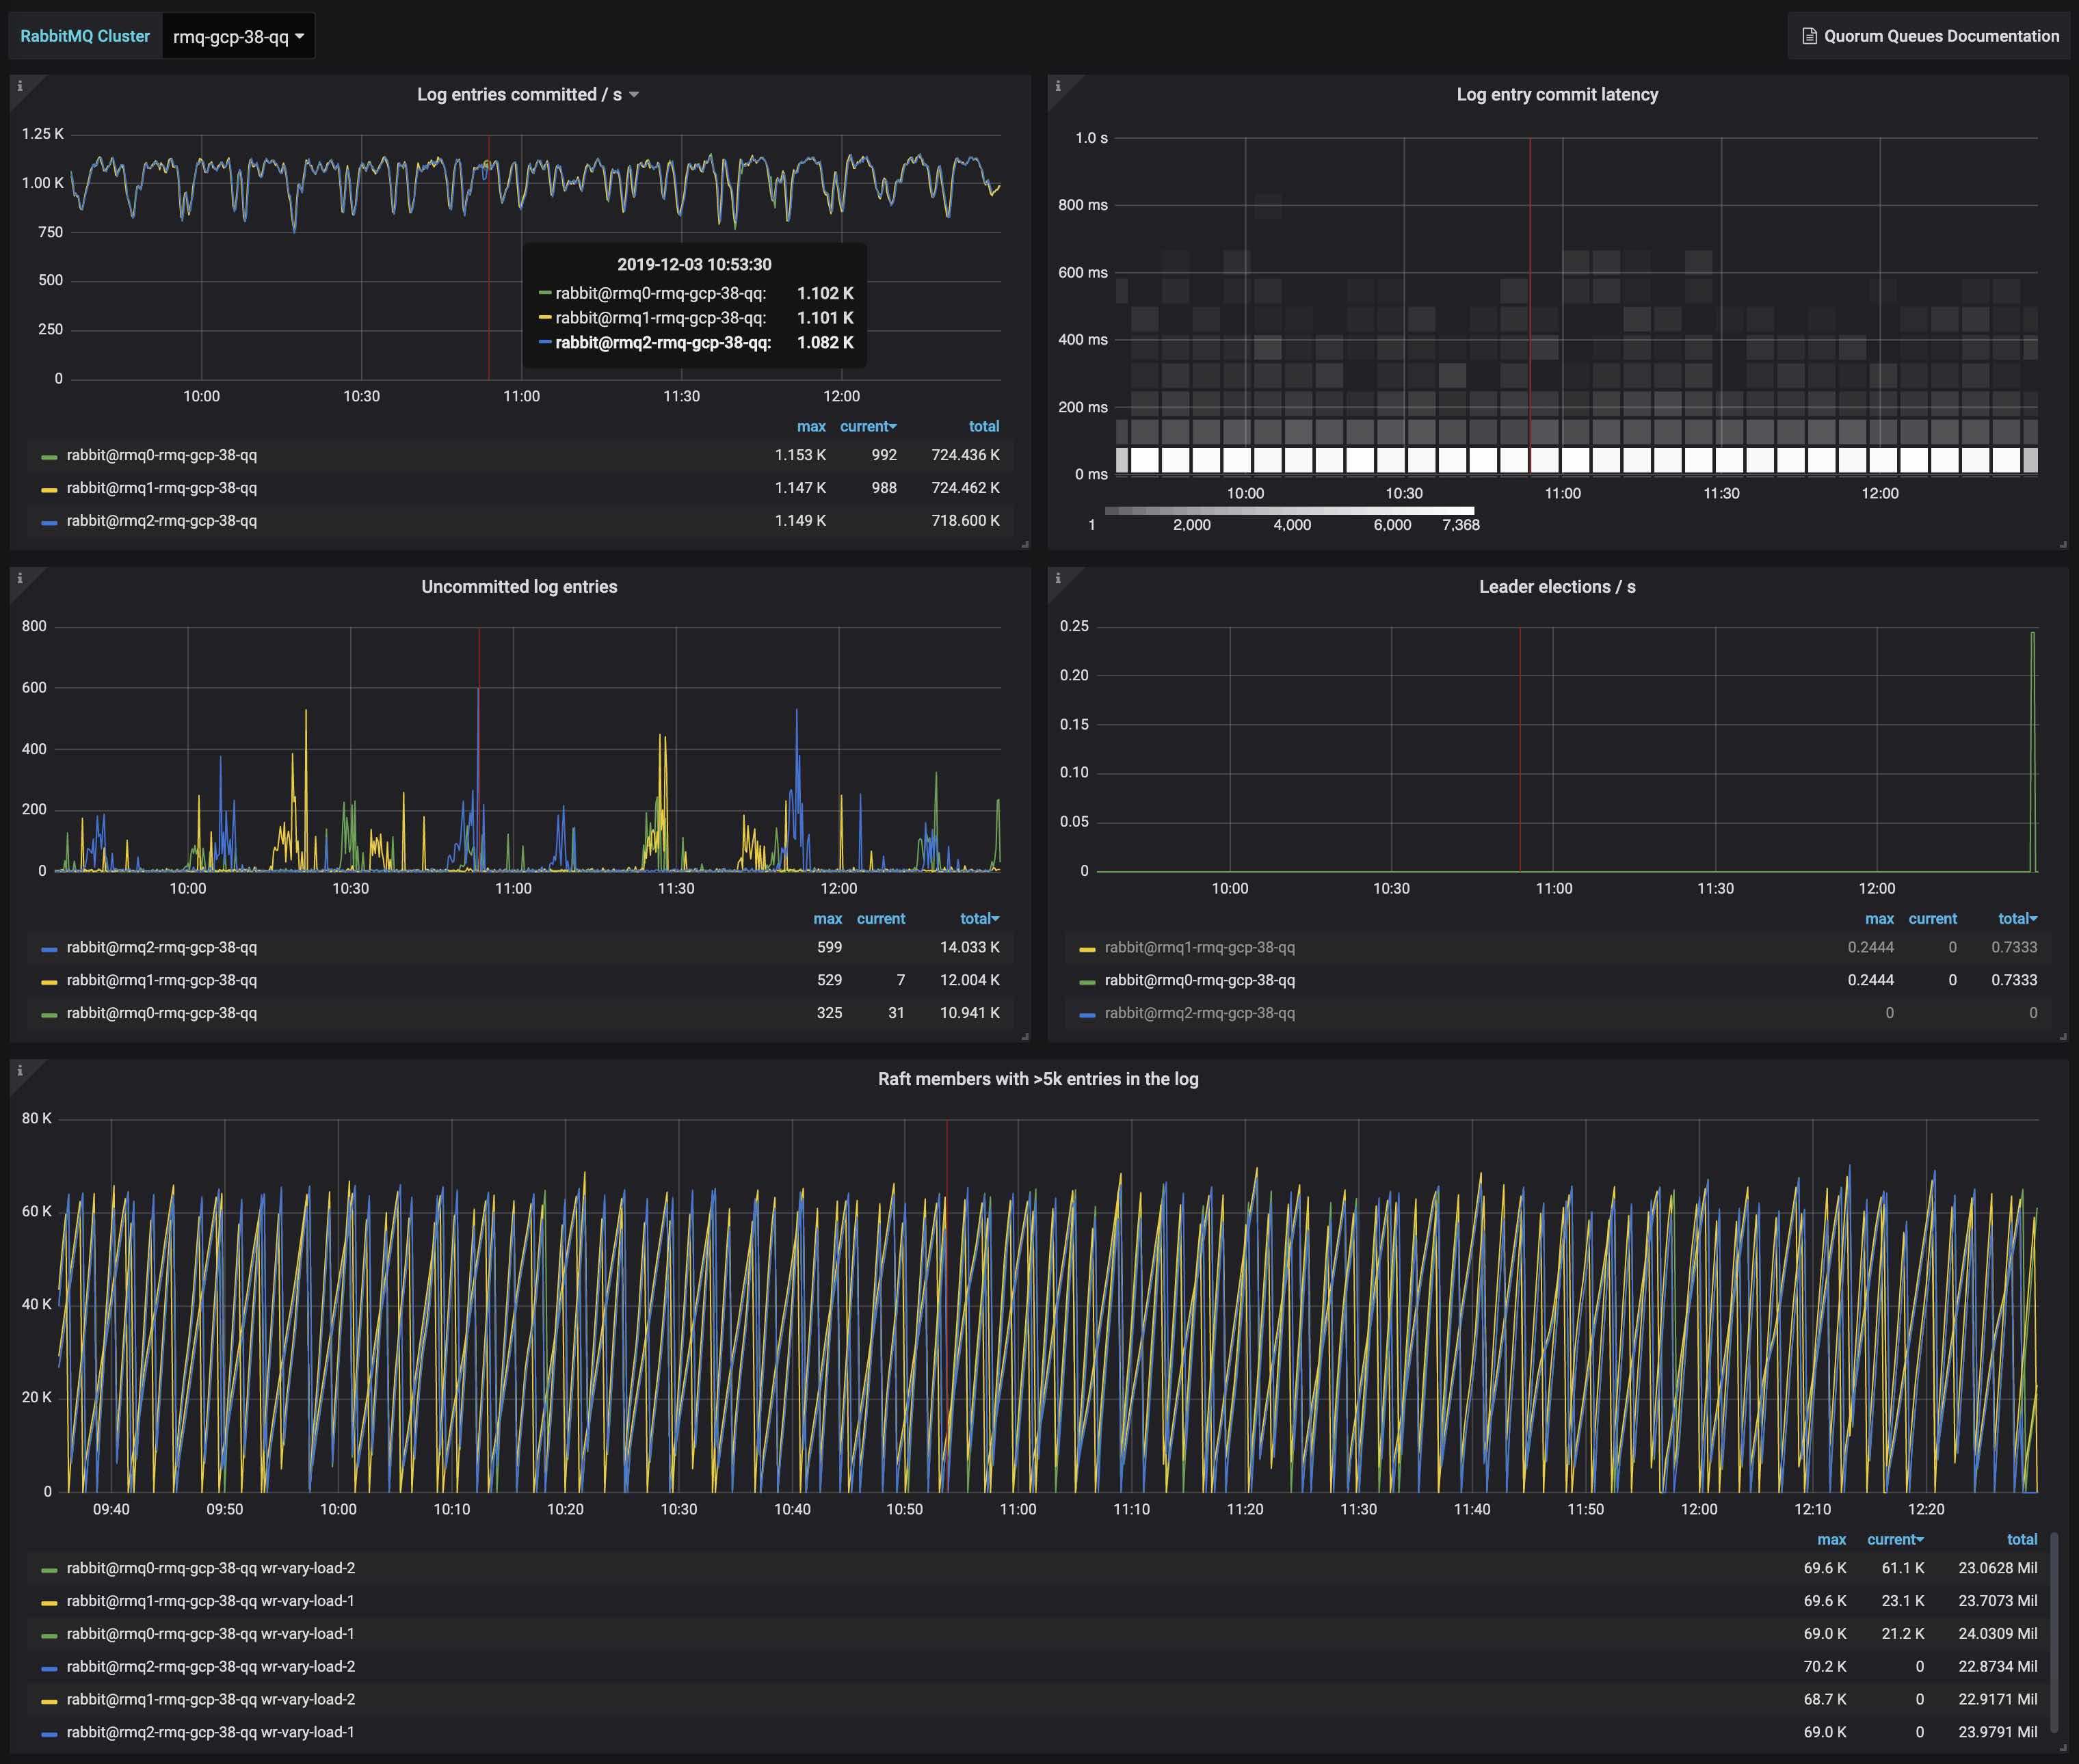
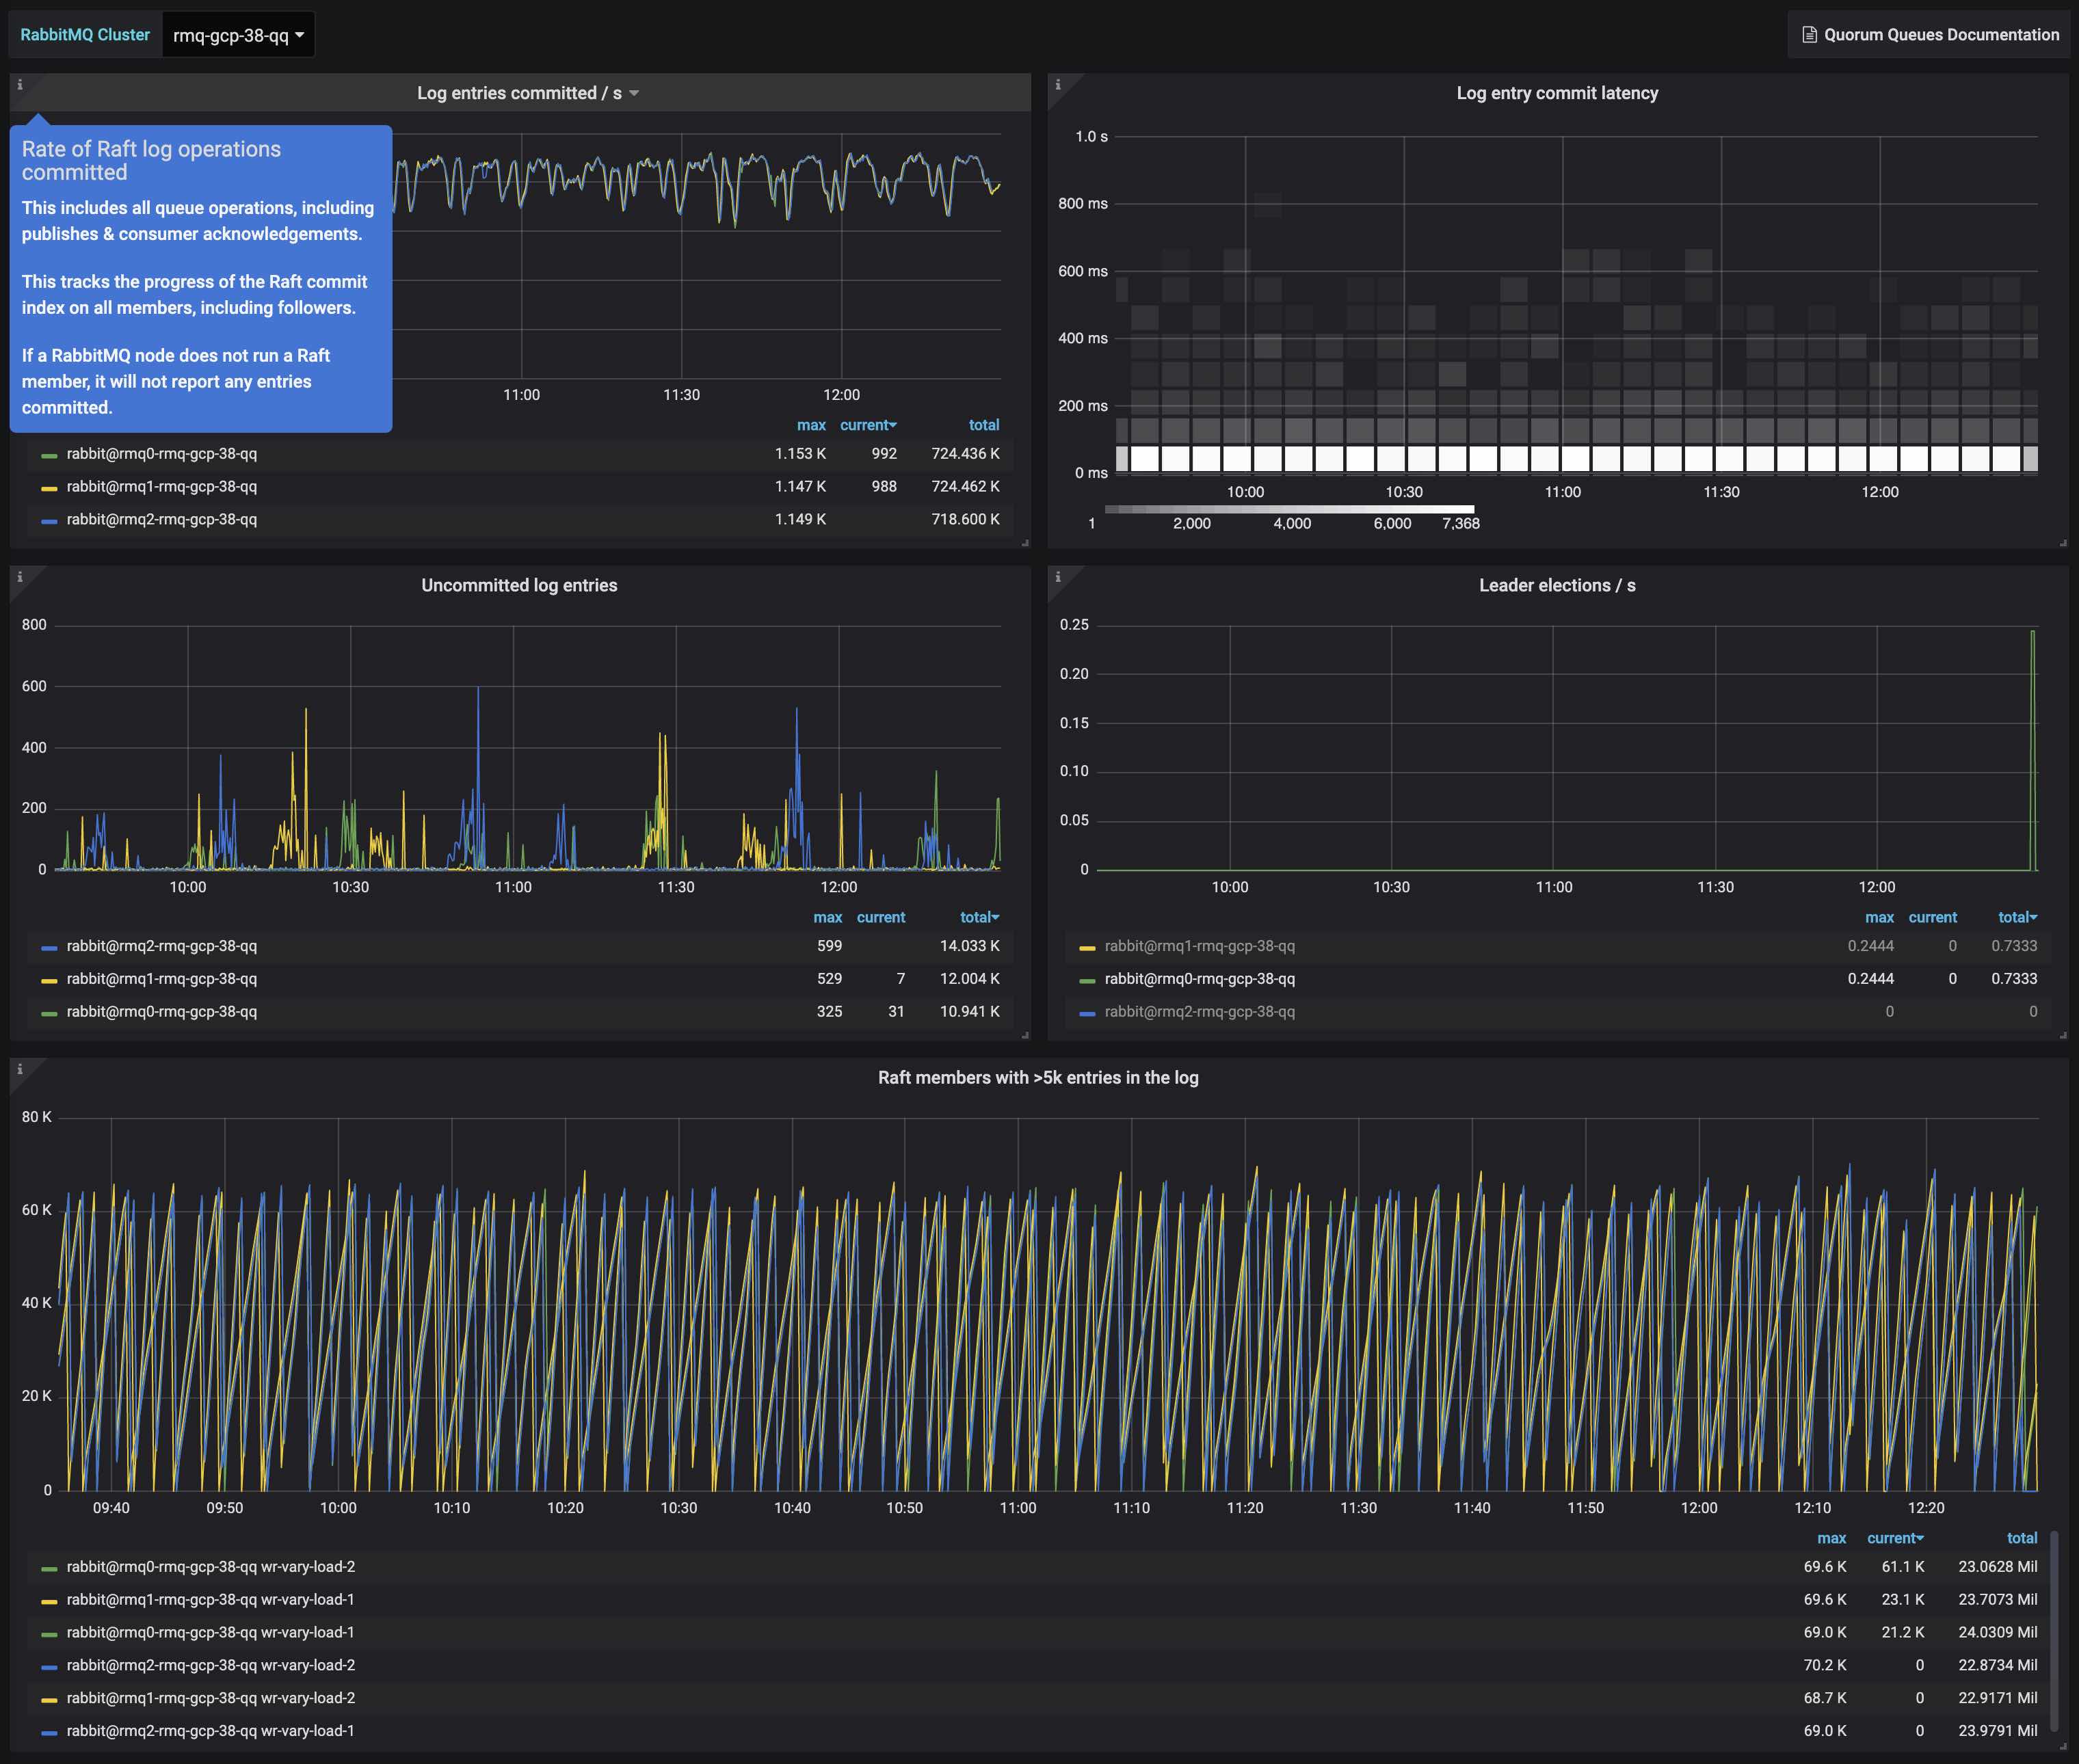
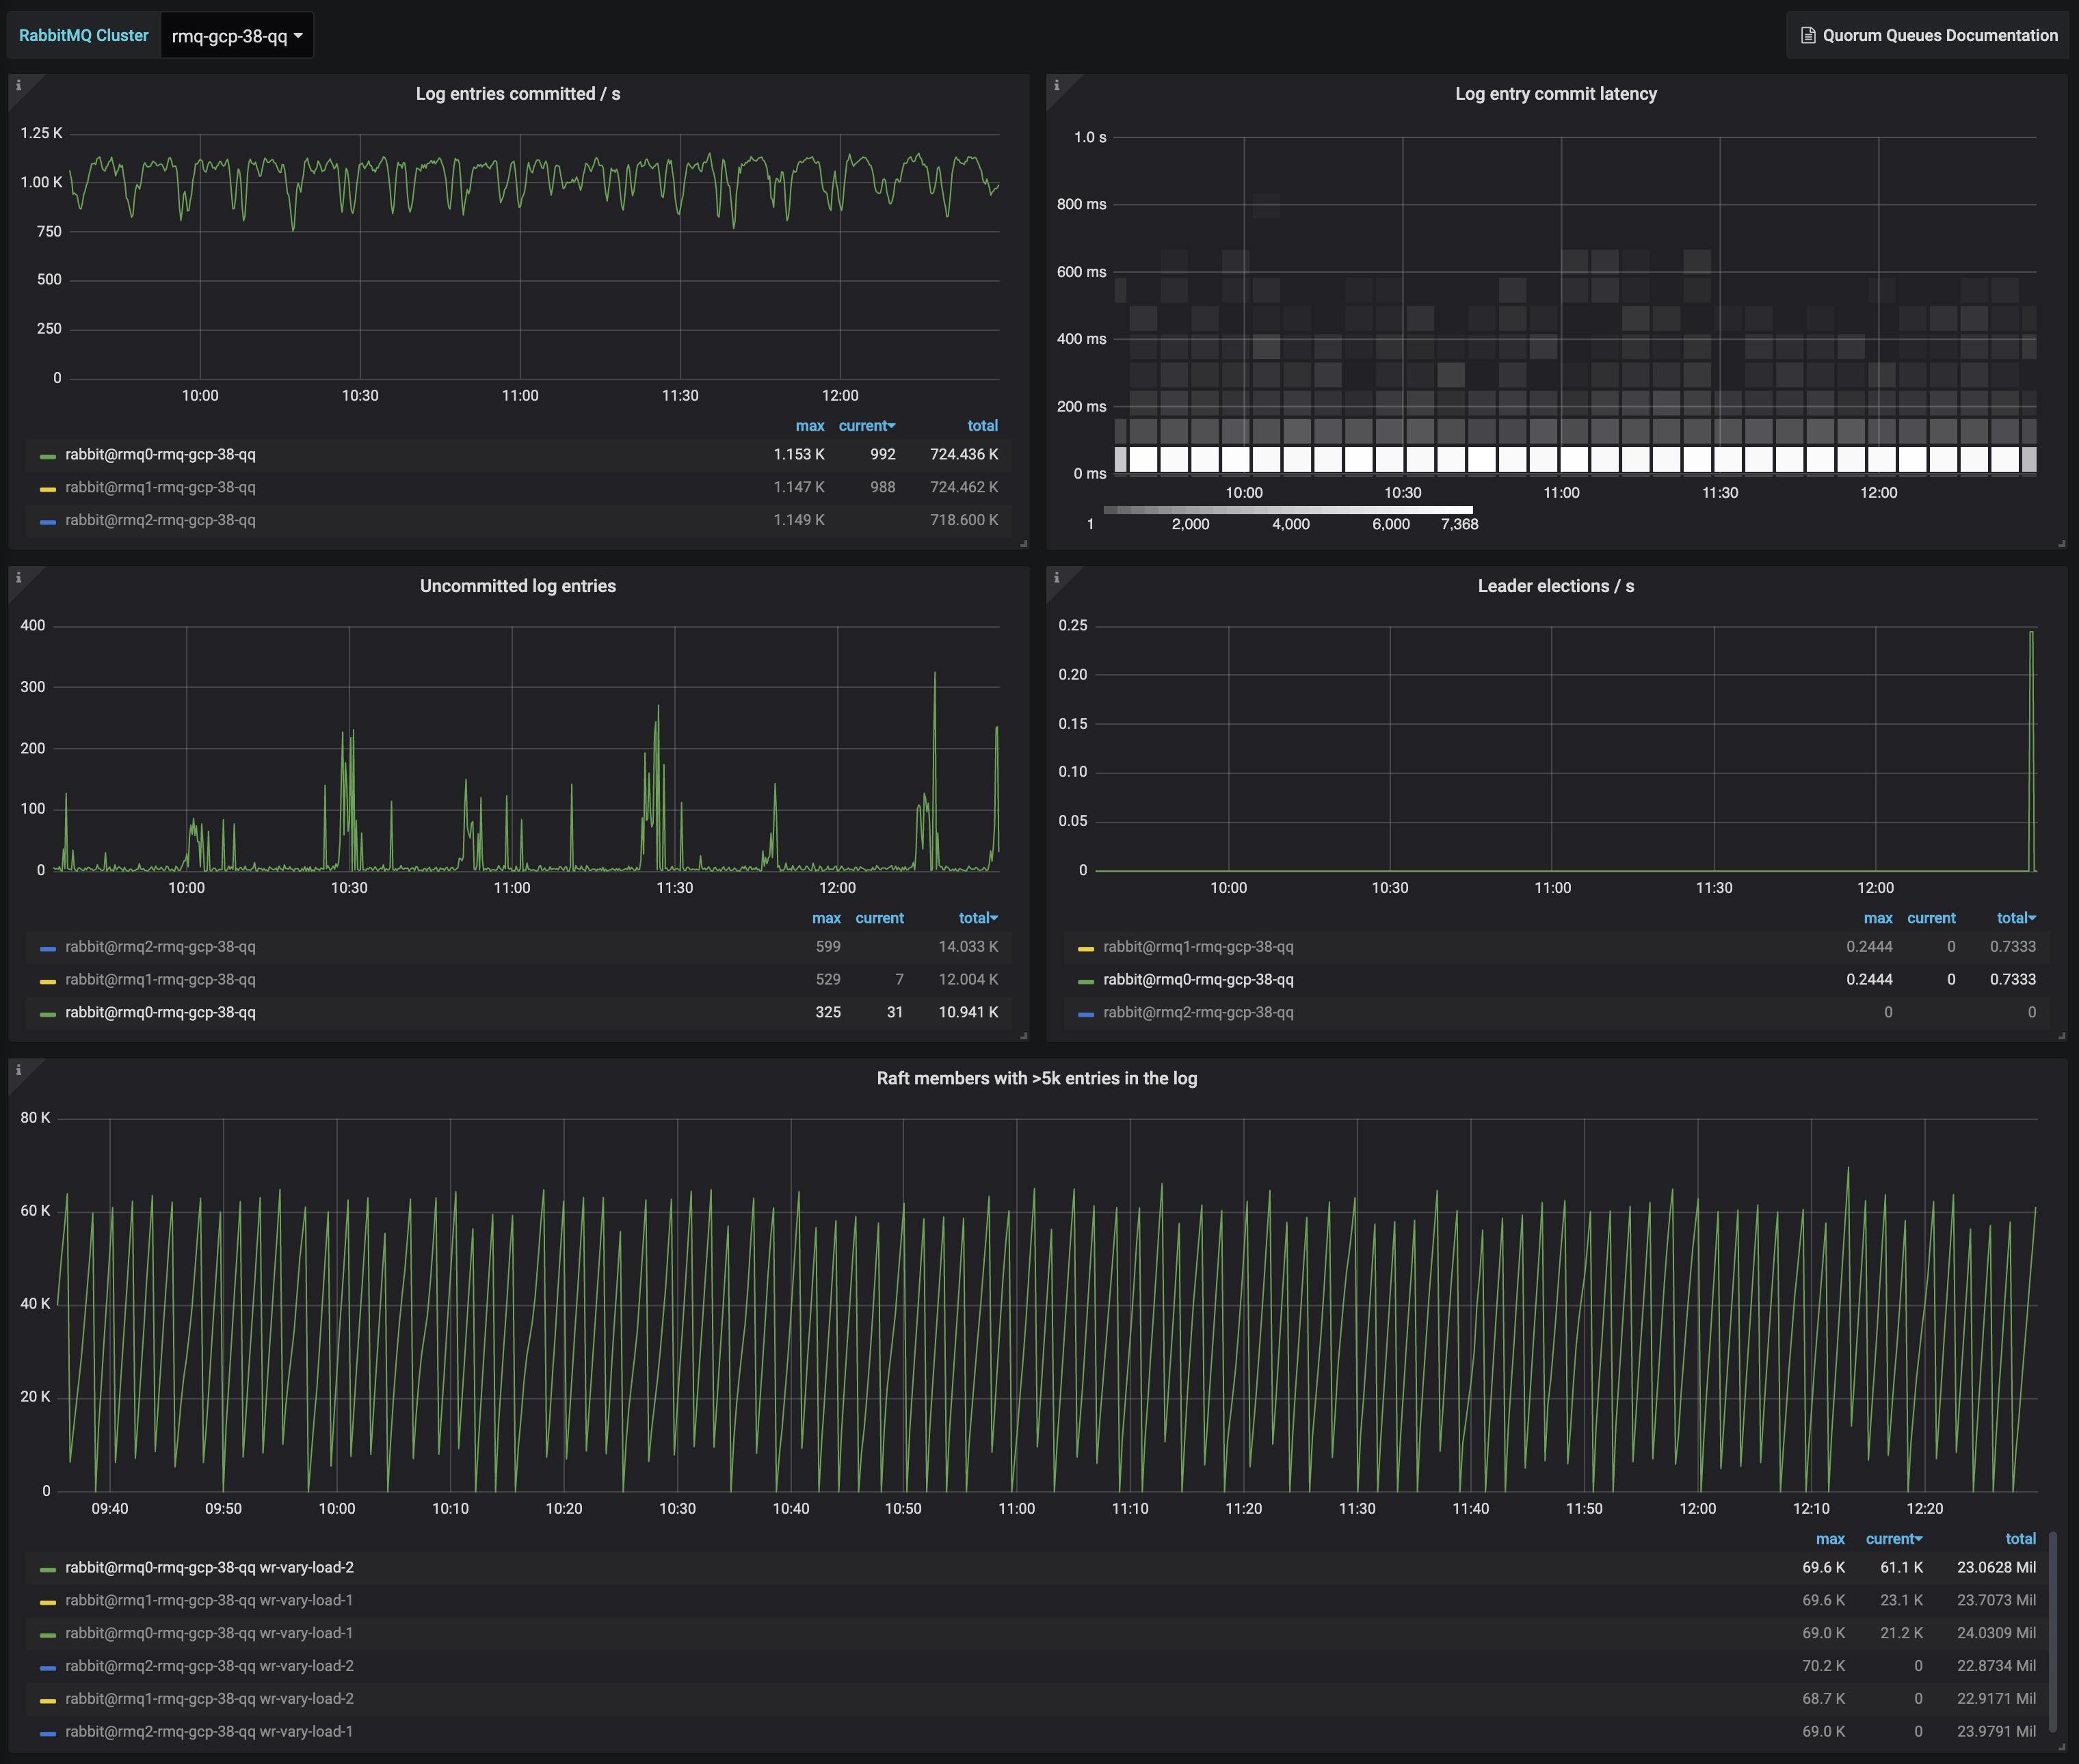
Helps understand the state of all Raft members running the Quorum Queues in a RabbitMQ 3.8.x cluster.
Metrics displayed:
- Log entries committed / s
- Log entry commit latency
- Uncommitted log entries
- Leader elections / s
- Raft members with >5k entries in the log
Filter by:
- RabbitMQ Cluster
Depends on rabbitmq-prometheus plugin, built-in since RabbitMQ v3.8.0
Learn more about RabbitMQ built-in Prometheus support
To get it working locally with RabbitMQ in 3 simple steps, follow this Quick Start guide
Data source config
Collector type:
Collector plugins:
Collector config:
Revisions
Upload an updated version of an exported dashboard.json file from Grafana
| Revision | Description | Created | |
|---|---|---|---|
| Download |
RabbitMQ
Easily monitor RabbitMQ, the most widely deployed open source message broker, with Grafana Cloud's out-of-the-box monitoring solution.
Learn more