
KubeCost
fixed images
Dashboard made using https://github.com/kubecost/cost-model open source metrics.
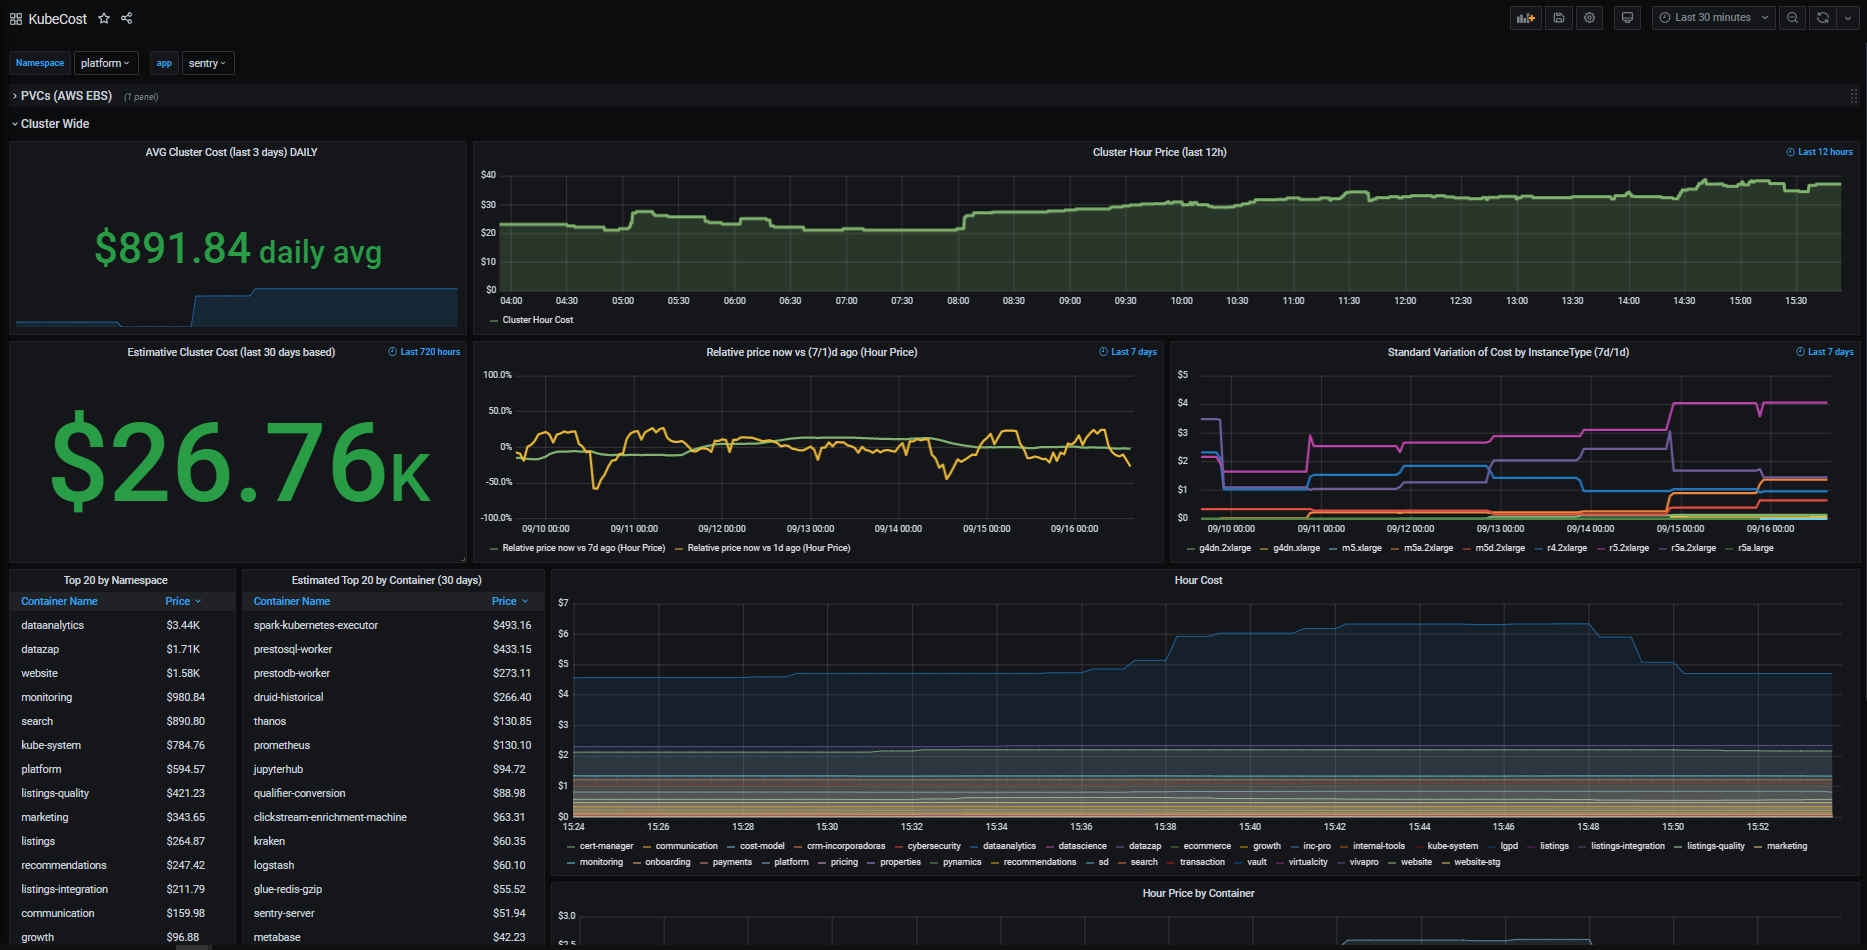
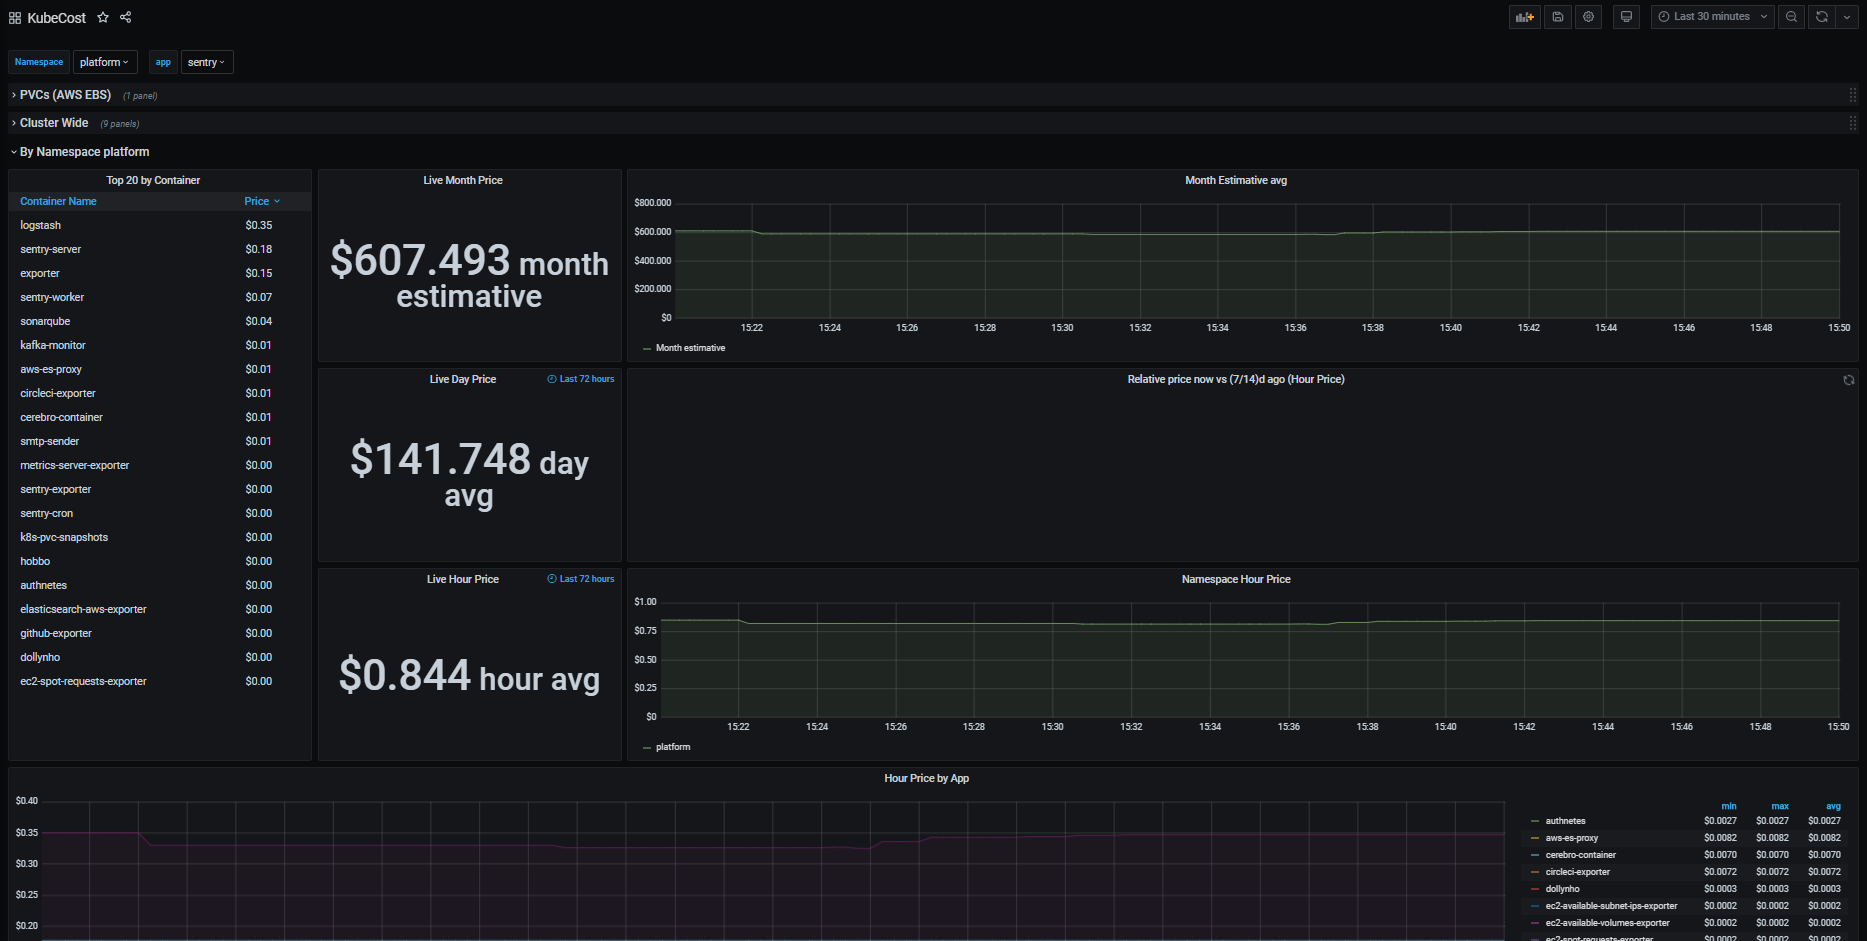
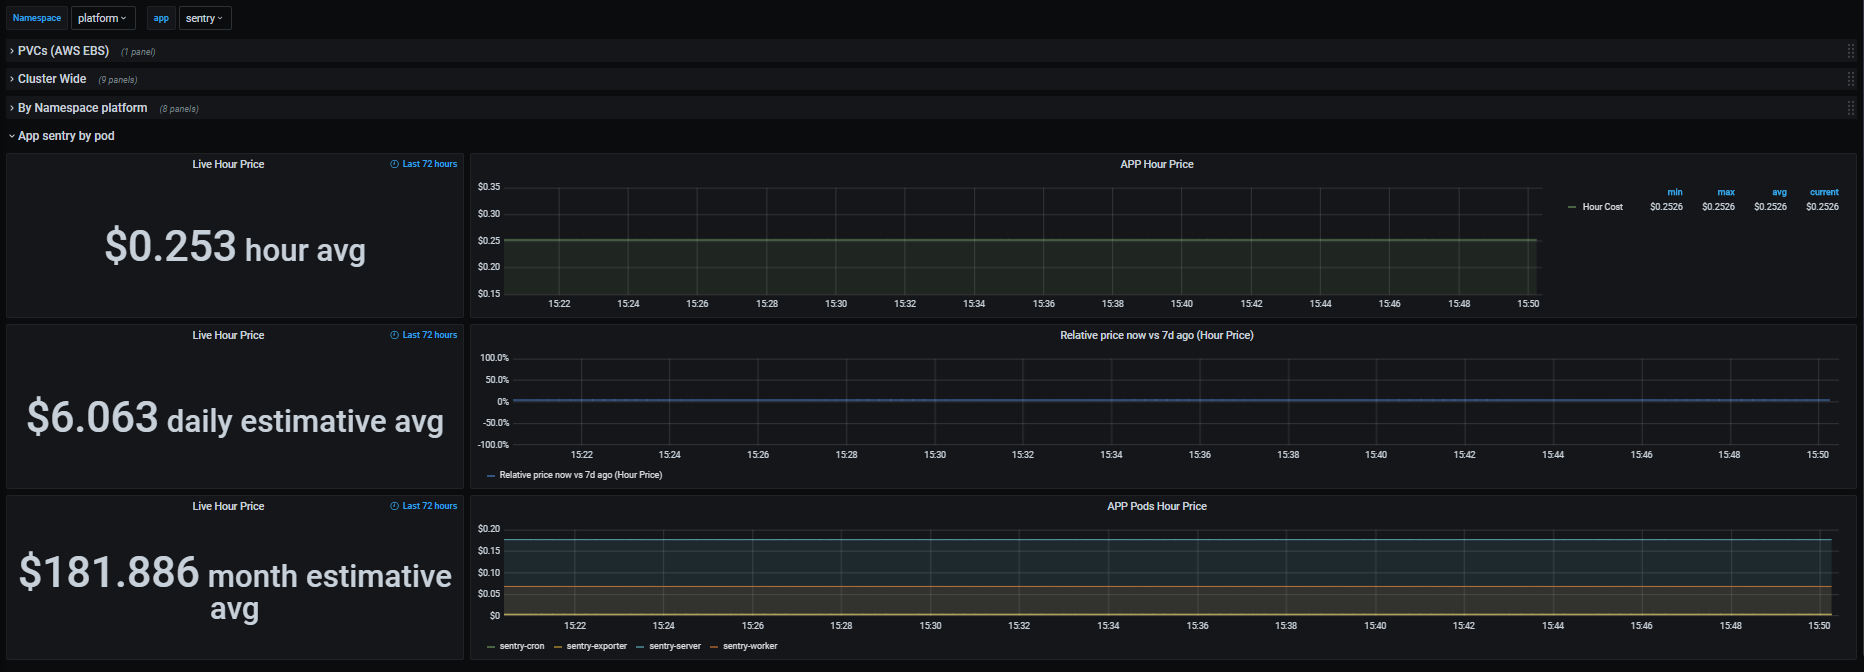
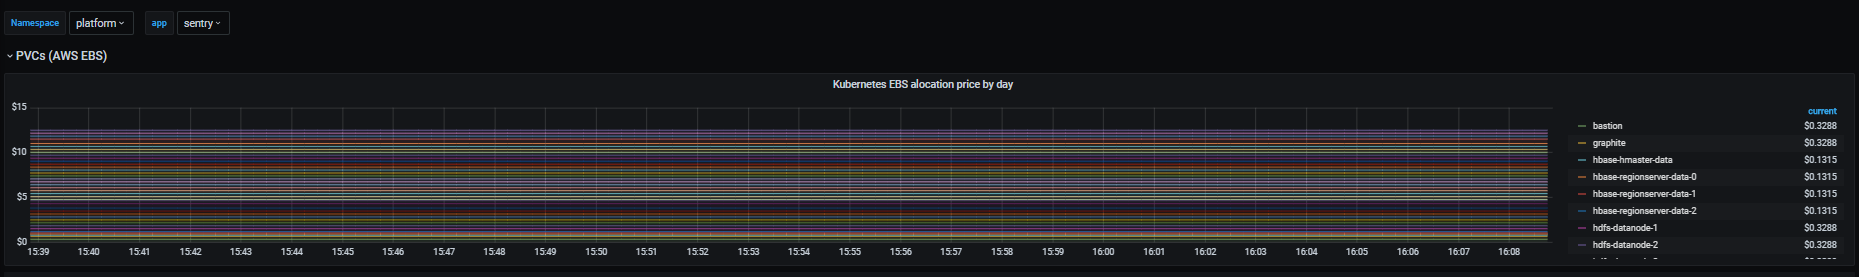
This dashboard gives your Kubernetes cluster costs:
- Cluster Wide (Live and Estimative)
- Relative price of spot instances
- Namespace (Live and Estimative)
- Price variation between days and weeks
- APP (Live and average)
- Price comparisson with 7 days ago
- PVC Costs
** CONFIGURING YOUR DEPLOYMENTS/STATEFULSETS/SERVICES/CRONJOBS/DS with a label app and product is essential to use all features of the dashboard**
To use the dashboard just add the following scrap rule to your Prometheus and import the dashboard to Grafana.
- job_name: kubecost
  honor_labels: true
  scrape_interval: 1m
  scrape_timeout: 10s
  metrics_path: /metrics
  scheme: http
  static_configs:
  - targets:
    - < address of cost-model service> # example: <service-name>.<namespace>:<port>
All metrics were made using the following docs: https://github.com/kubecost/cost-model/blob/master/PROMETHEUS.md
Problems or suggestions, reach me at https://github.com/gkope
Data source config
Collector type:
Collector plugins:
Collector config:
Dashboard revisions
Upload an updated version of an exported dashboard.json file from Grafana
| Revision | Decscription | Created | |
|---|---|---|---|
| Download |
Sign up for Grafana Cloud

Get up and running in minutes with the Grafana Cloud free tier, which includes free forever 10k metrics, 50GB logs, 50GB traces, 500 VUh, and more.
Get this dashboard
Data source:
Dependencies: