sFlow-RT Network Interfaces
Busiest network interfaces based on sFlow telemetry
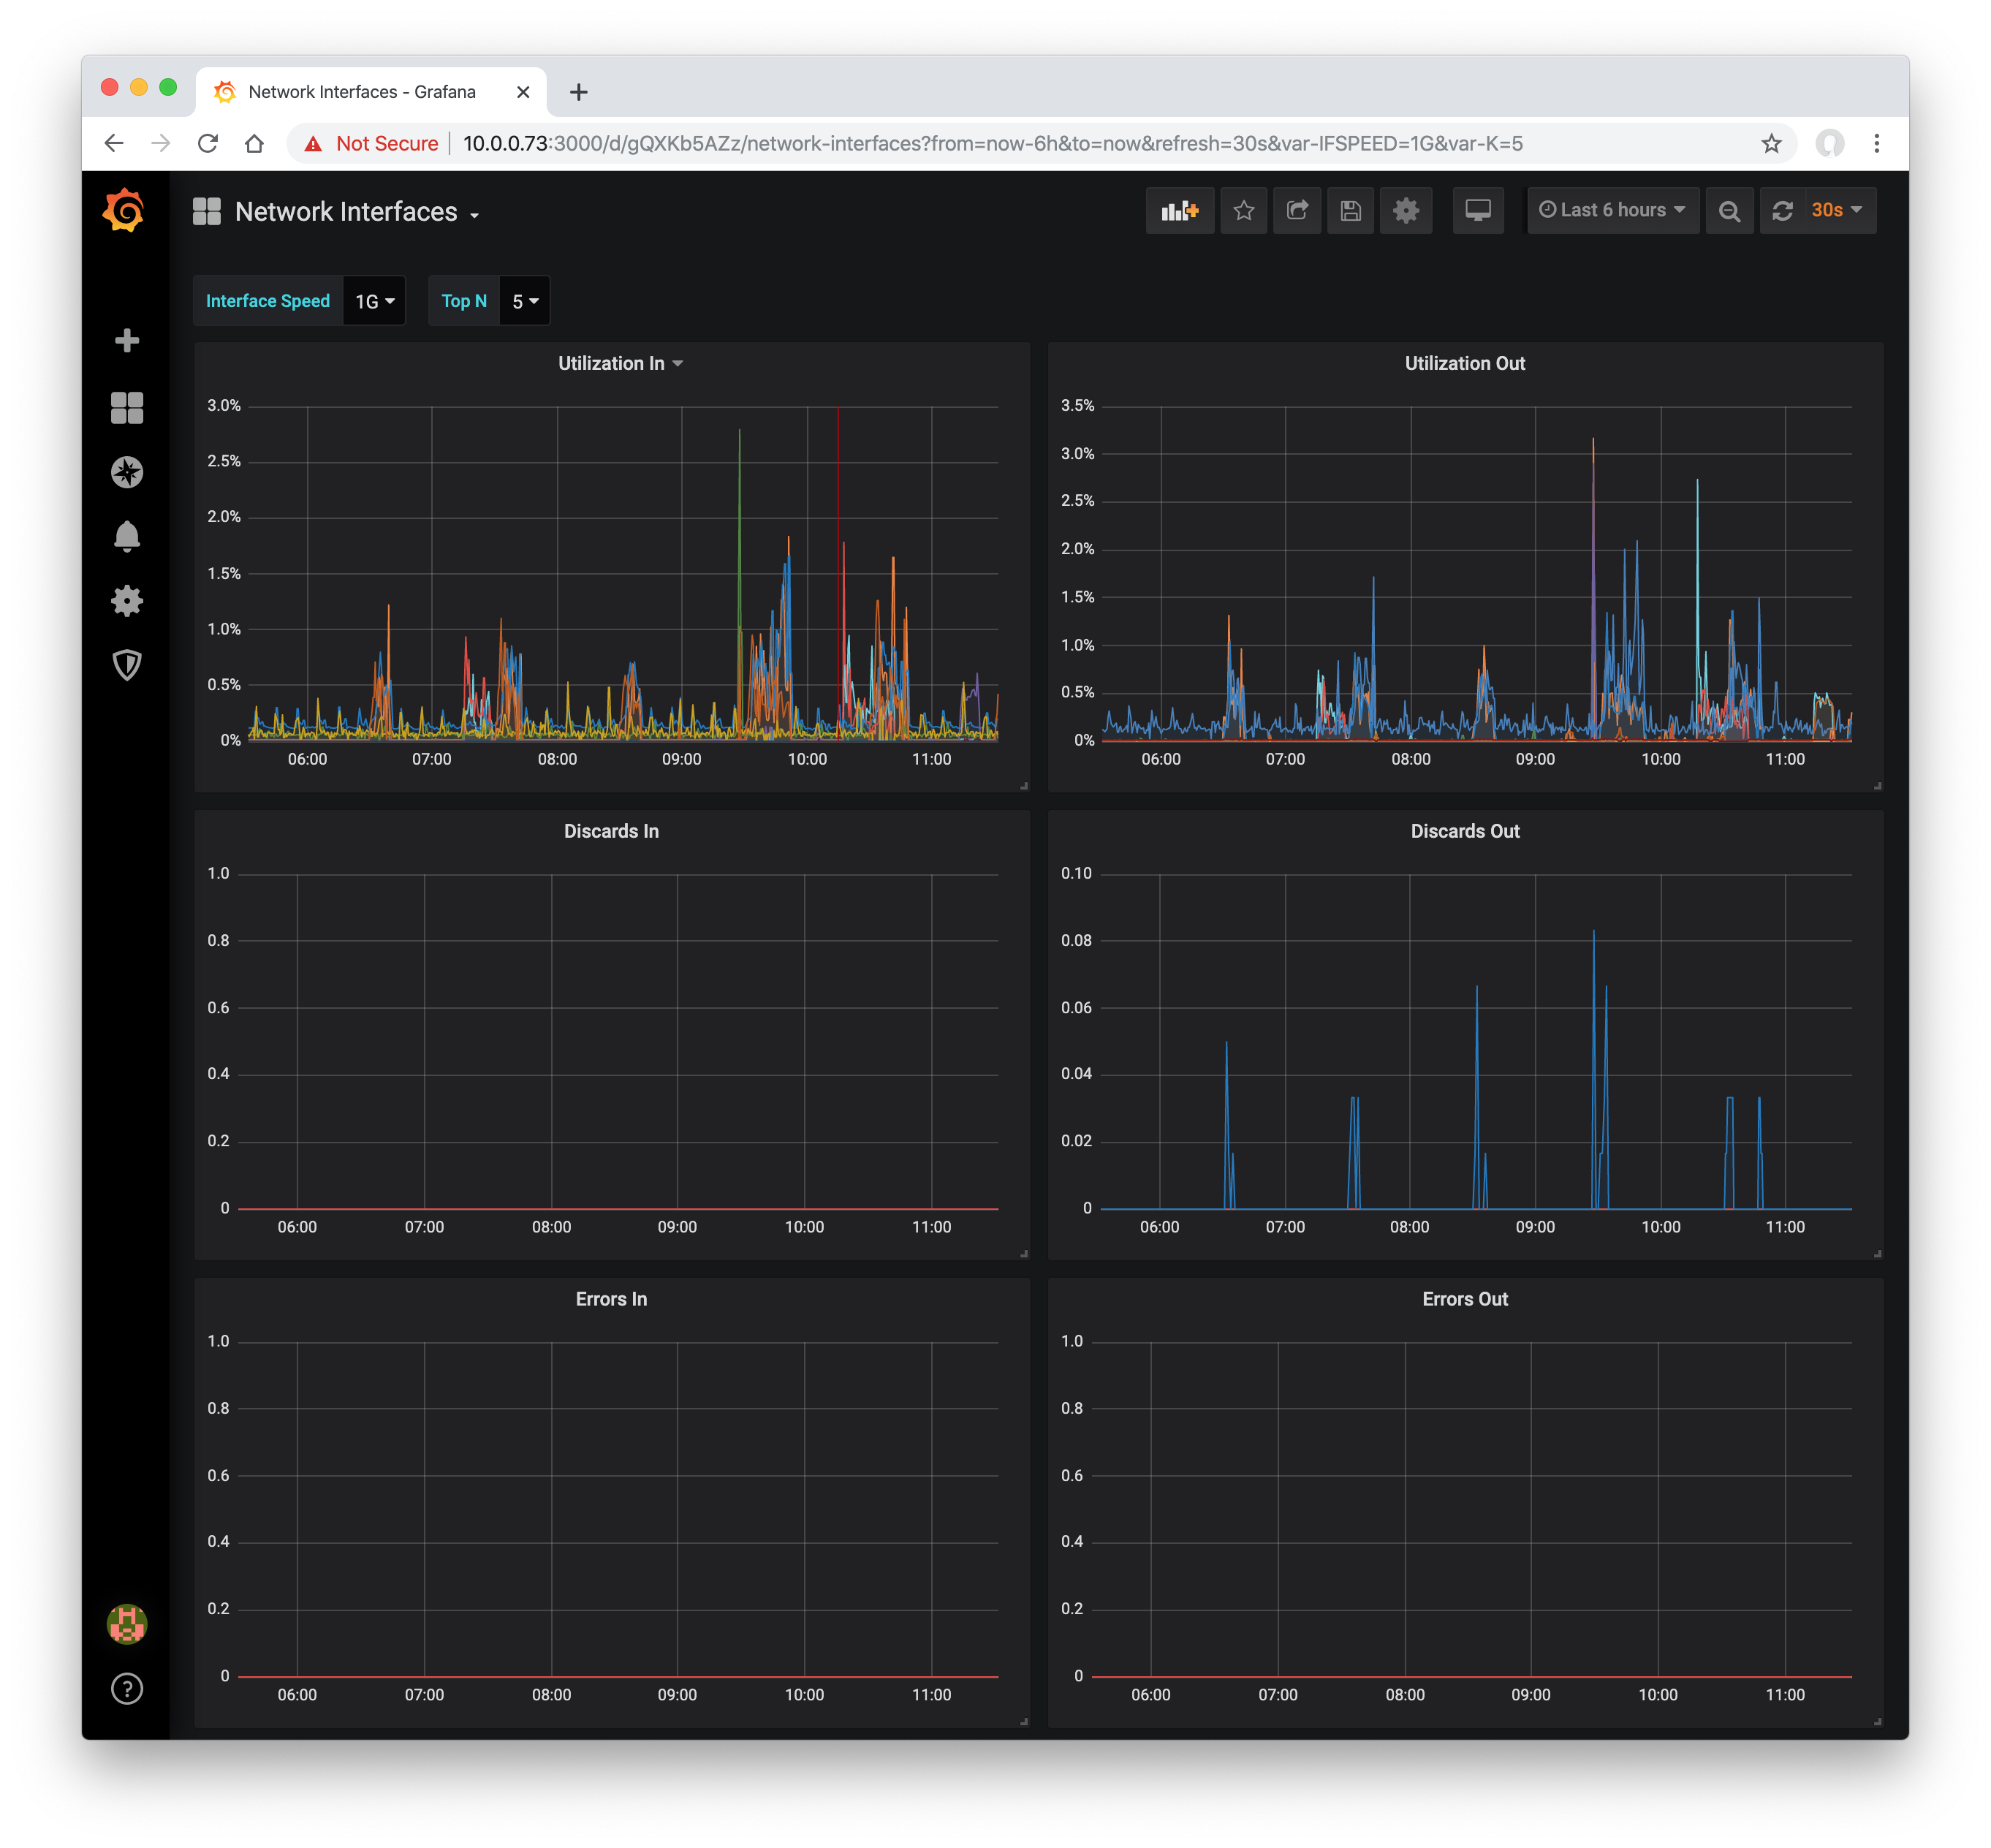
sFlow-RT Network Interfaces
This dashboard displays busiest network interfaces reported by sFlow-RT analyzer. The sFlow-RT analysis software collects streaming telemetry from industry standard sFlow Agents embedded in network devices.
Use the sflow/prometheus image to run sFlow-RT using Docker:
docker run -d -p 6343:6343/udp -p 8008:8008 sflow/prometheus
To enable SNMP to retrieve network device interface and system names, add the following option:
docker run -d -p 6343:6343/udp -p 8008:8008 sflow/prometheus -Dsnmp.ifname=yes
Use the following Prometheus scrape configuration to collect the metrics from sFlow-RT:
scrape_configs:
  - job_name: 'sflow-rt-analyzer'
    metrics_path: /prometheus/analyzer/txt
    static_configs:
      - targets: ['sflow-rt.mysite.org:8008']
  - job_name: 'sflow-rt-metrics'
    metrics_path: /prometheus/metrics/ALL/ALL/txt
    static_configs:
      - targets: ['sflow-rt.mysite.org:8008']
    metric_relabel_configs:
      - source_labels: ['agent', 'datasource']
        separator: ':'
        target_label: instance
Data source config
Collector type:
Collector plugins:
Collector config:
Revisions
Upload an updated version of an exported dashboard.json file from Grafana
| Revision | Description | Created | |
|---|---|---|---|
| Download |