VictoriaMetrics - cluster
Overview for cluster VictoriaMetrics v1.117.0 or higher
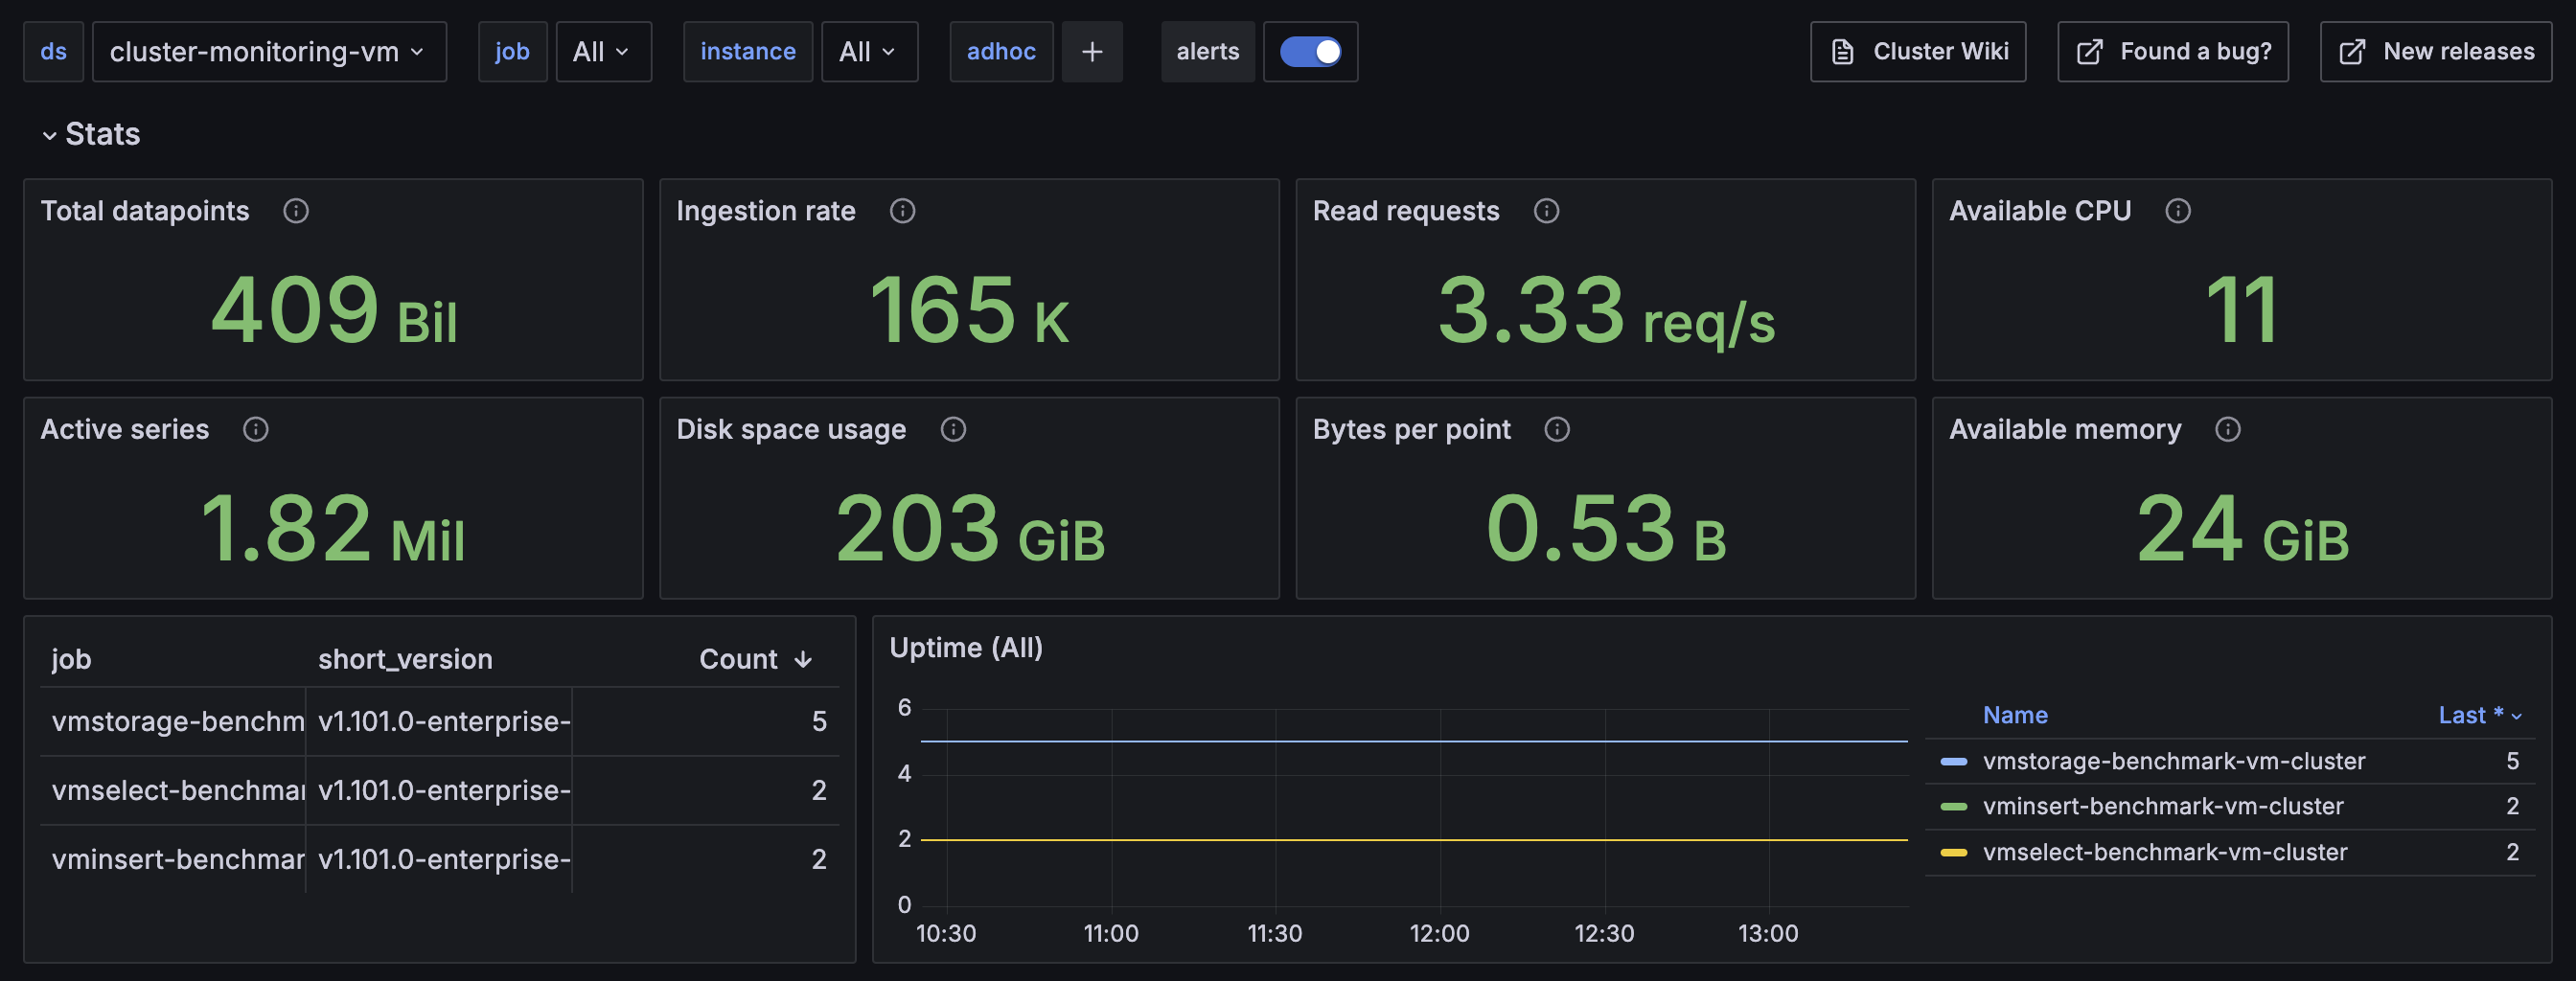
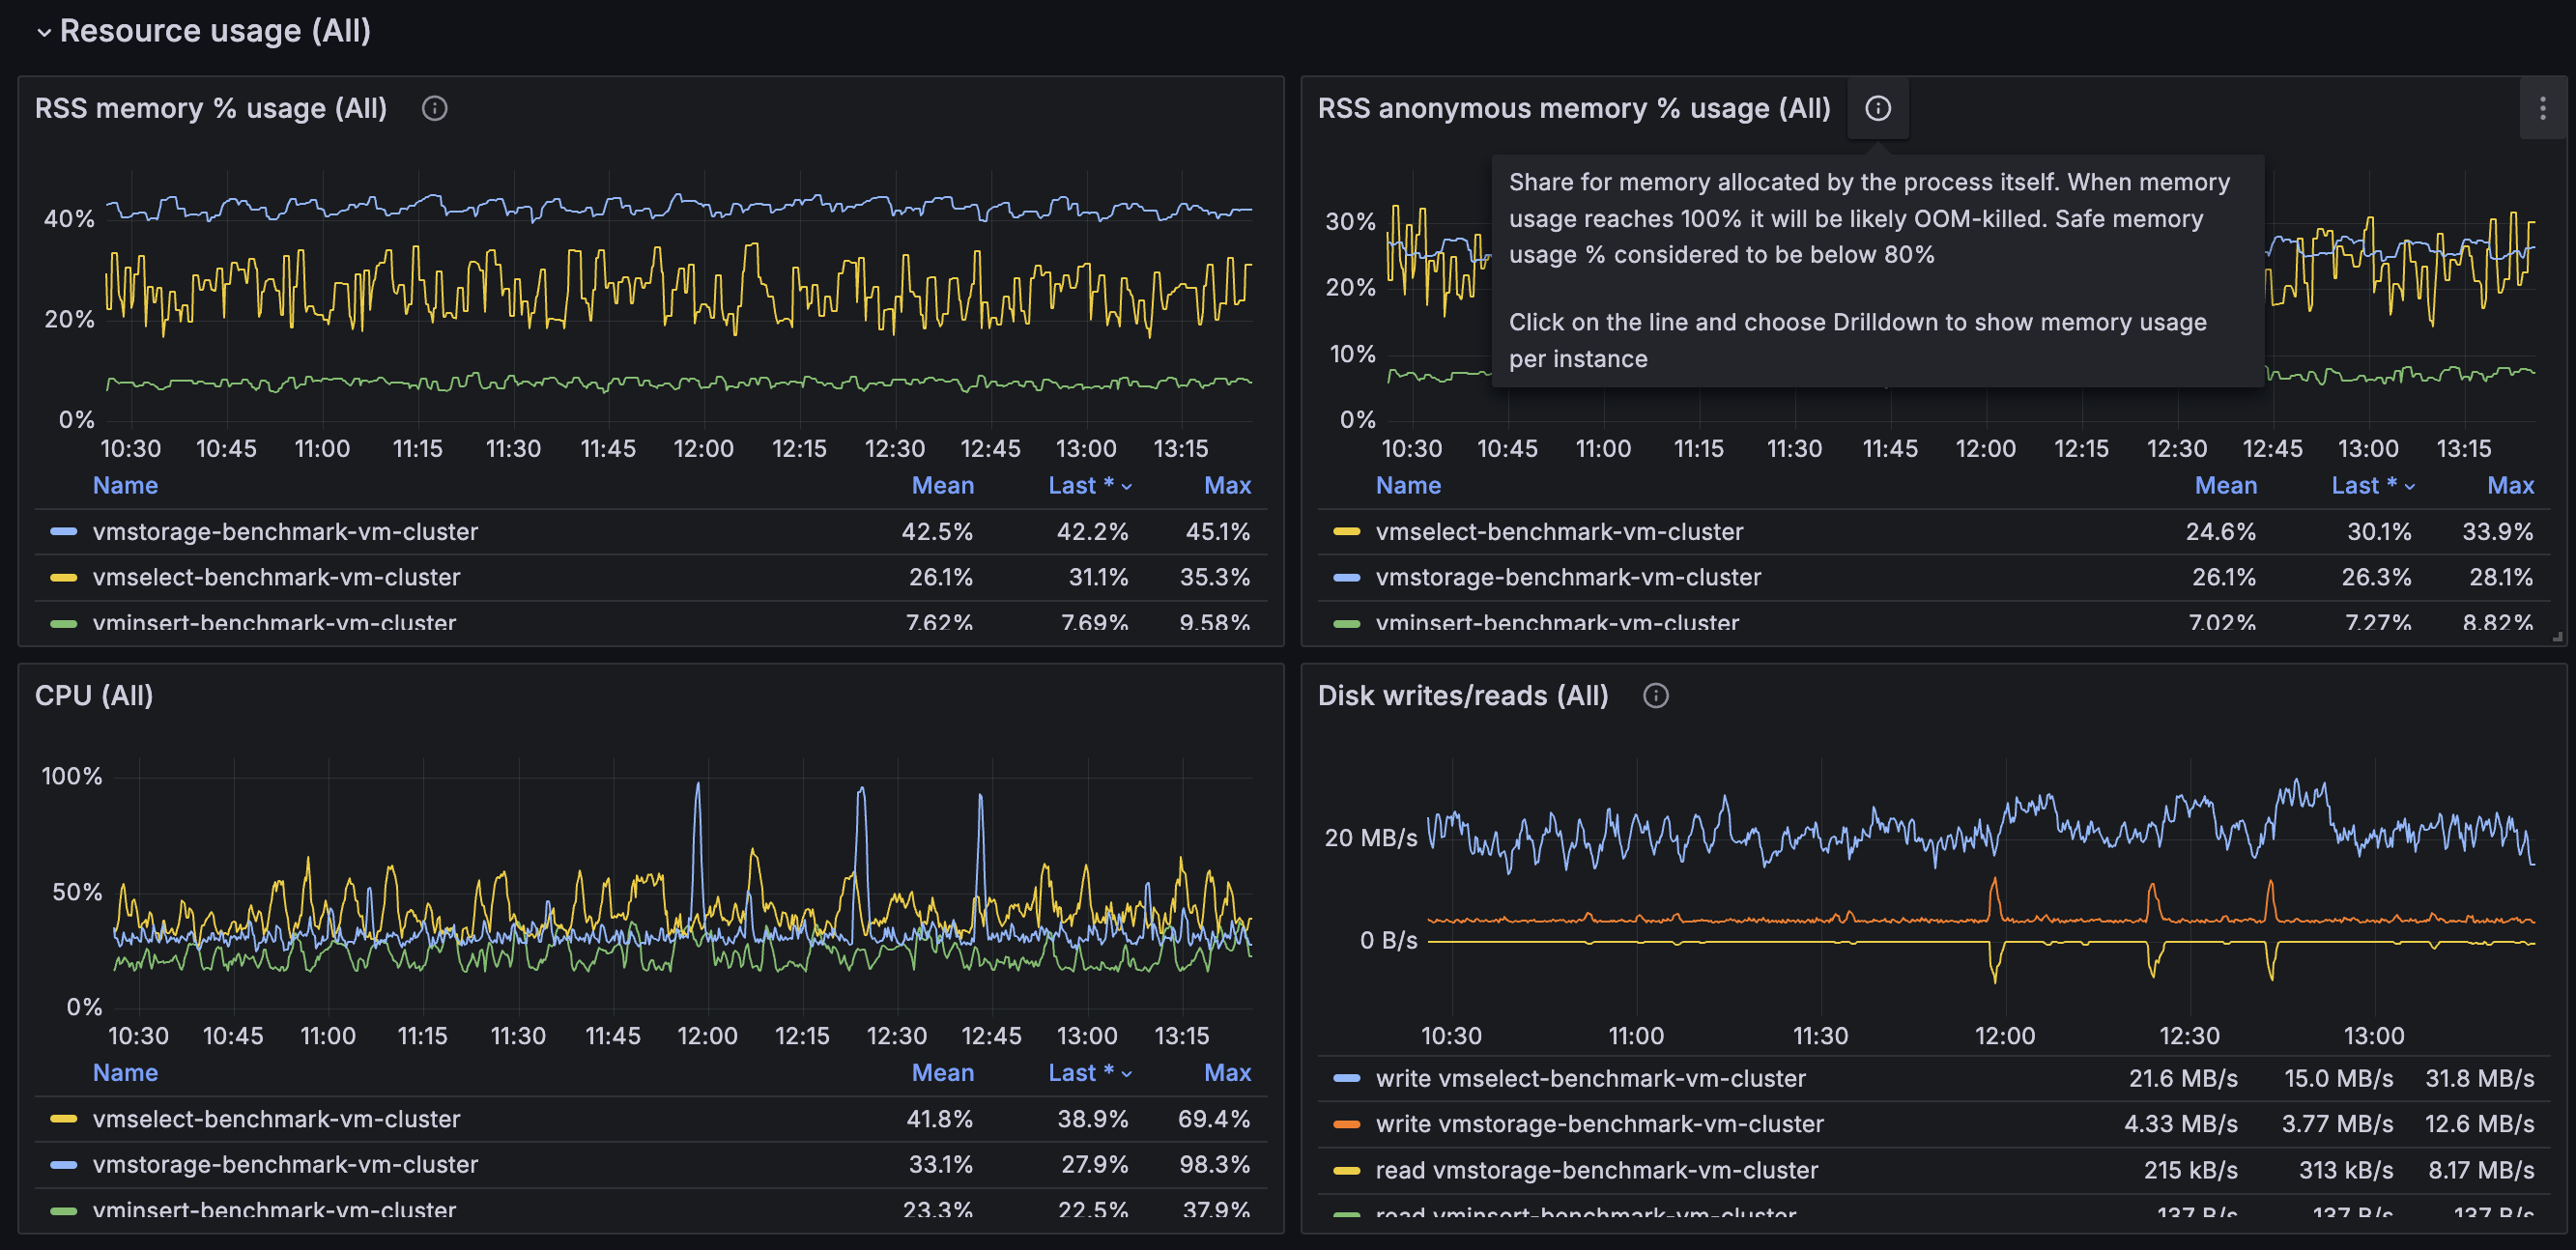
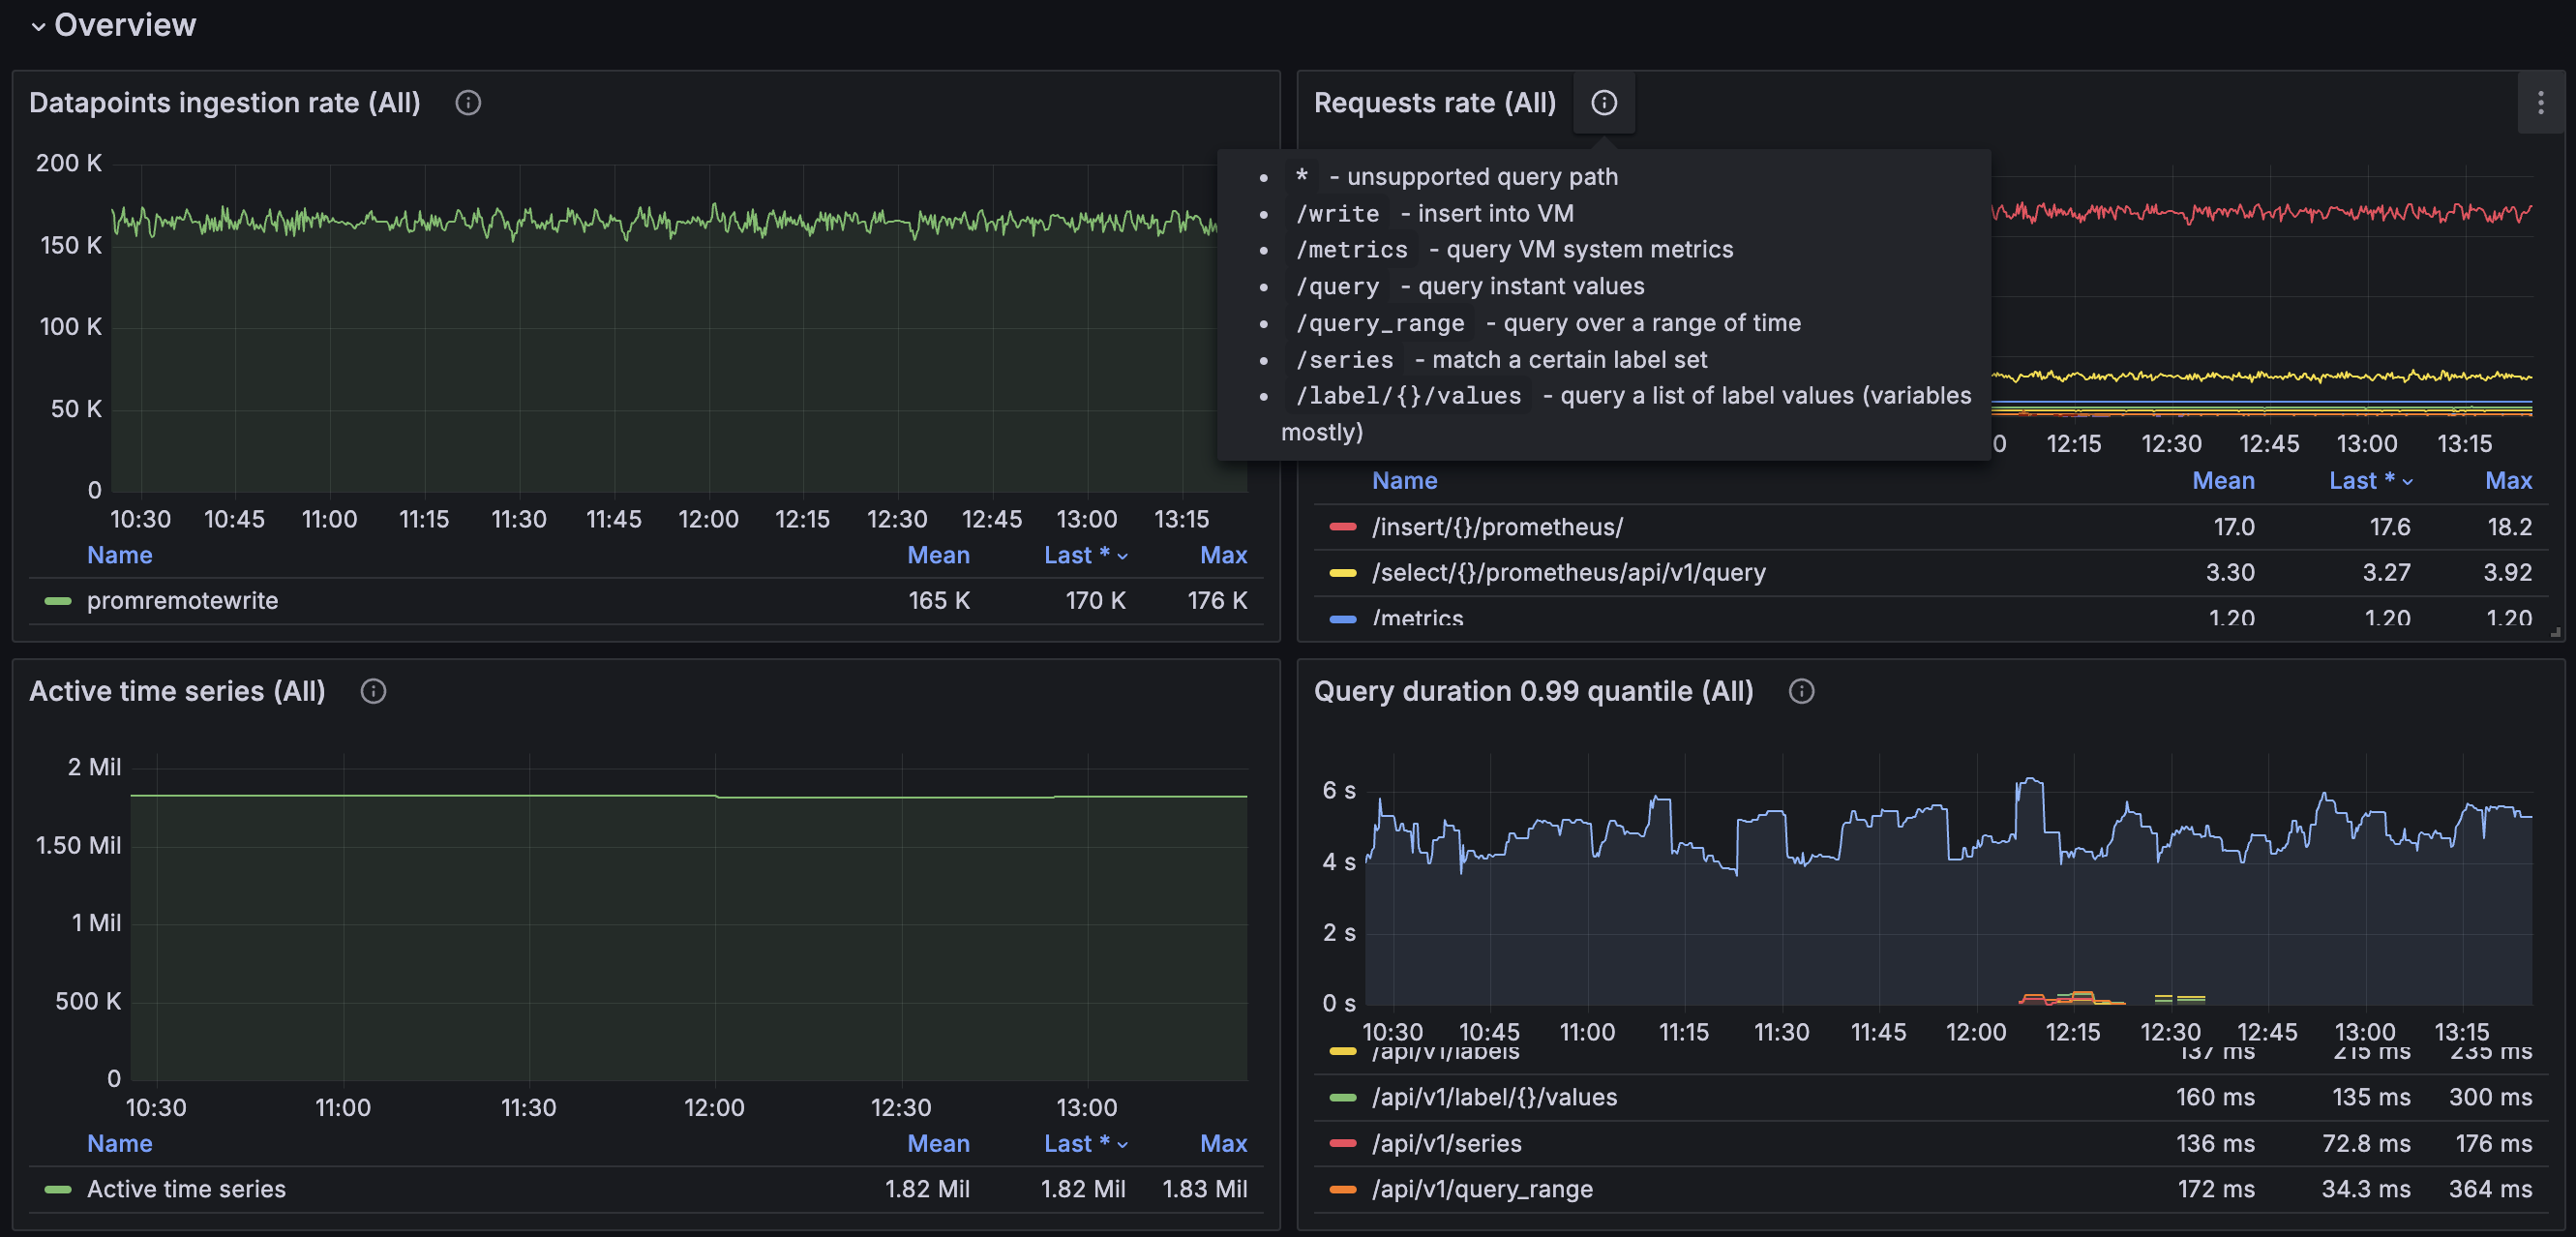
VictoriaMetrics cluster overview
Requirements
VictoriaMetrics: each revision may have different VictoriaMetrics version requirements.
Grafana: each revision may have different Grafana version requirements.
Use Prometheus datasource with this dashboard. See more details about how to configure monitoring here.
Description
The dashboard contains a visualization of the most useful metrics displaying the current state and performance of the service. It covers such aspects as RPC interconnections, caches, vmstorage, vmselect and vminsert. If you have suggestions or improvements or found a bug - feel free to add issue or add a review to the dashboard.
More information about VictoriaMetrics.
Data source config
Collector config:
Upload an updated version of an exported dashboard.json file from Grafana
| Revision | Description | Created | |
|---|---|---|---|
| Download |