AKA ES Nginx Logs_1.0
由青空完成
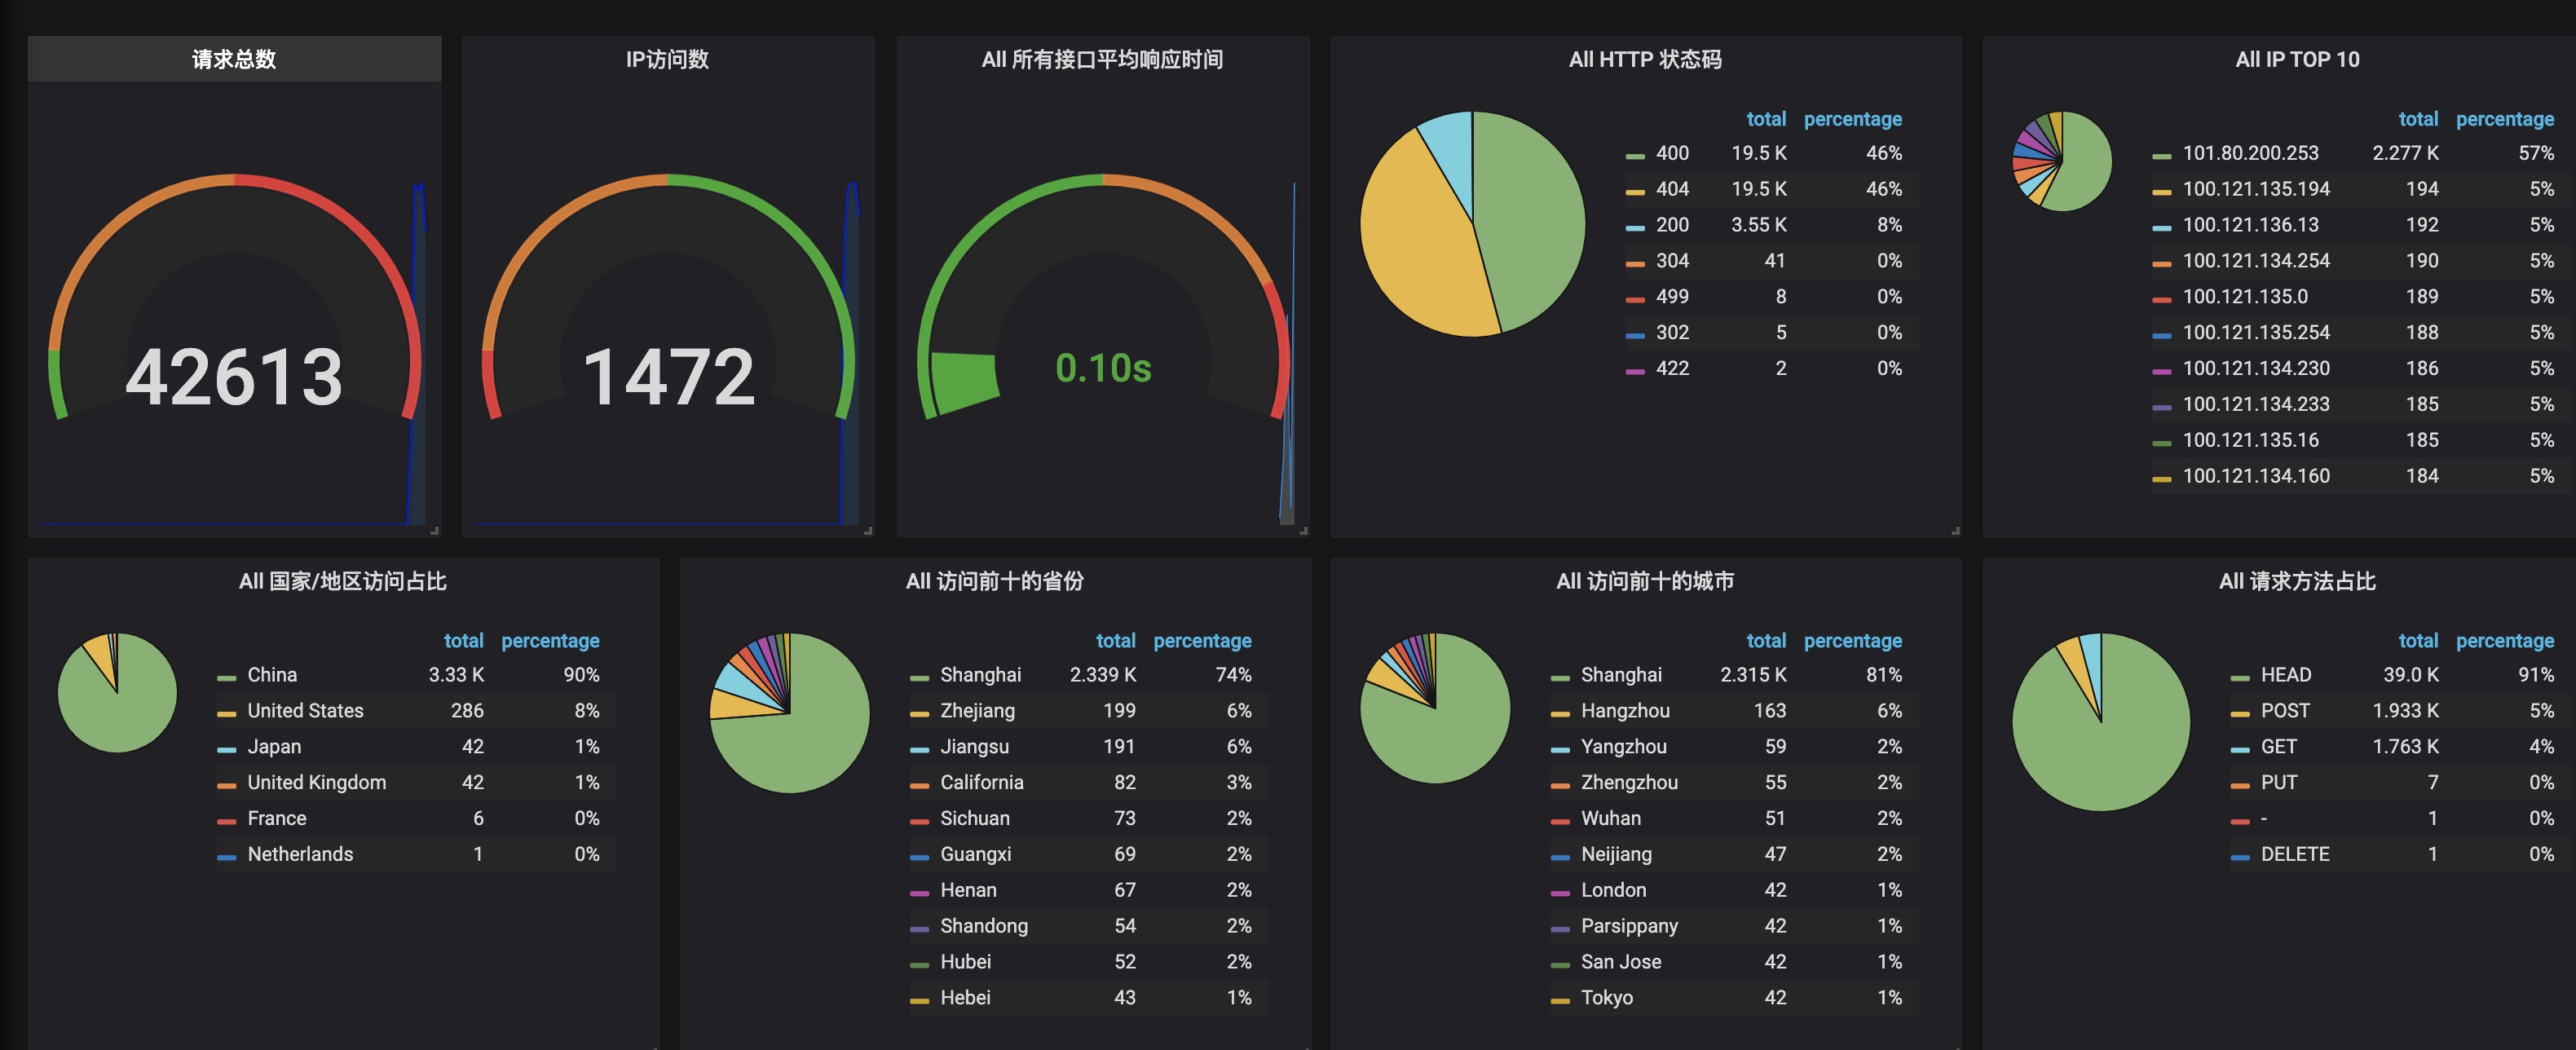
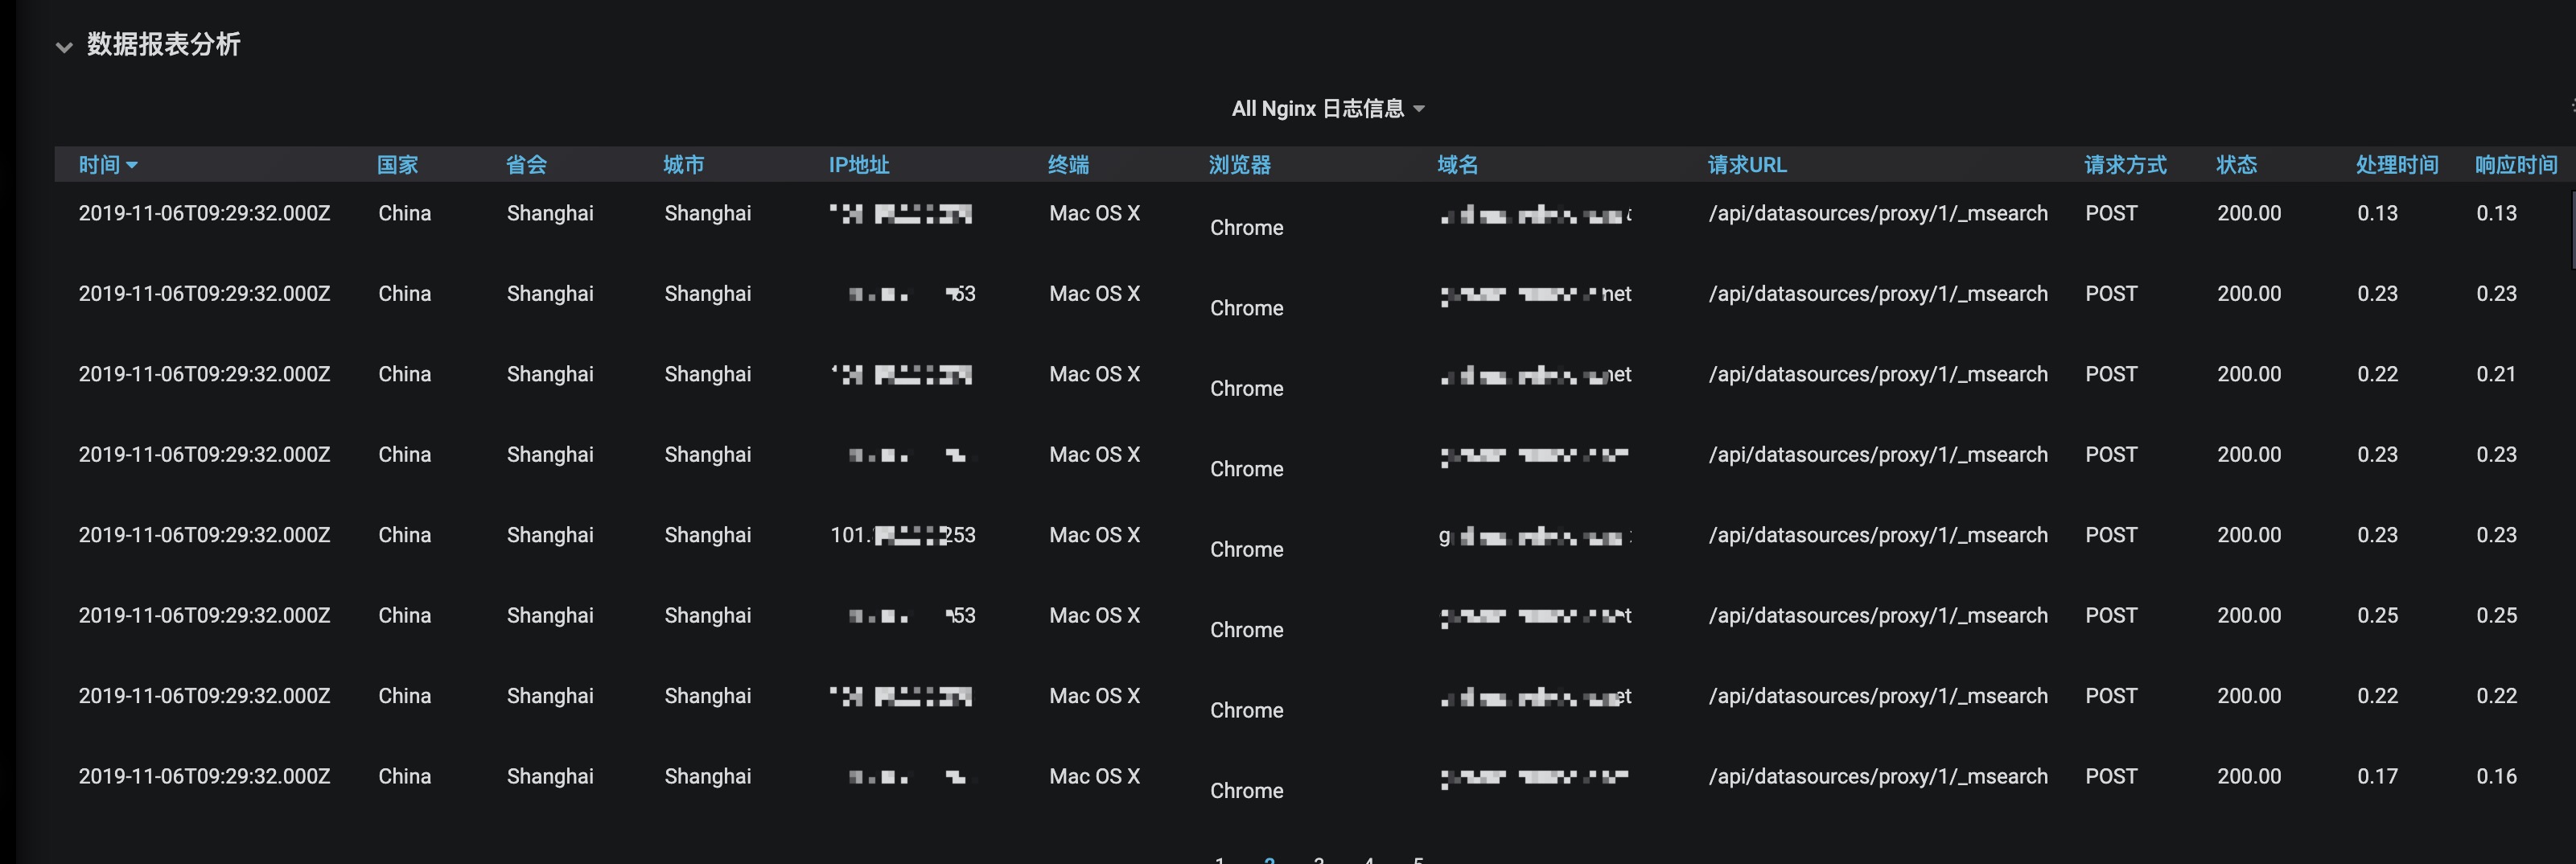
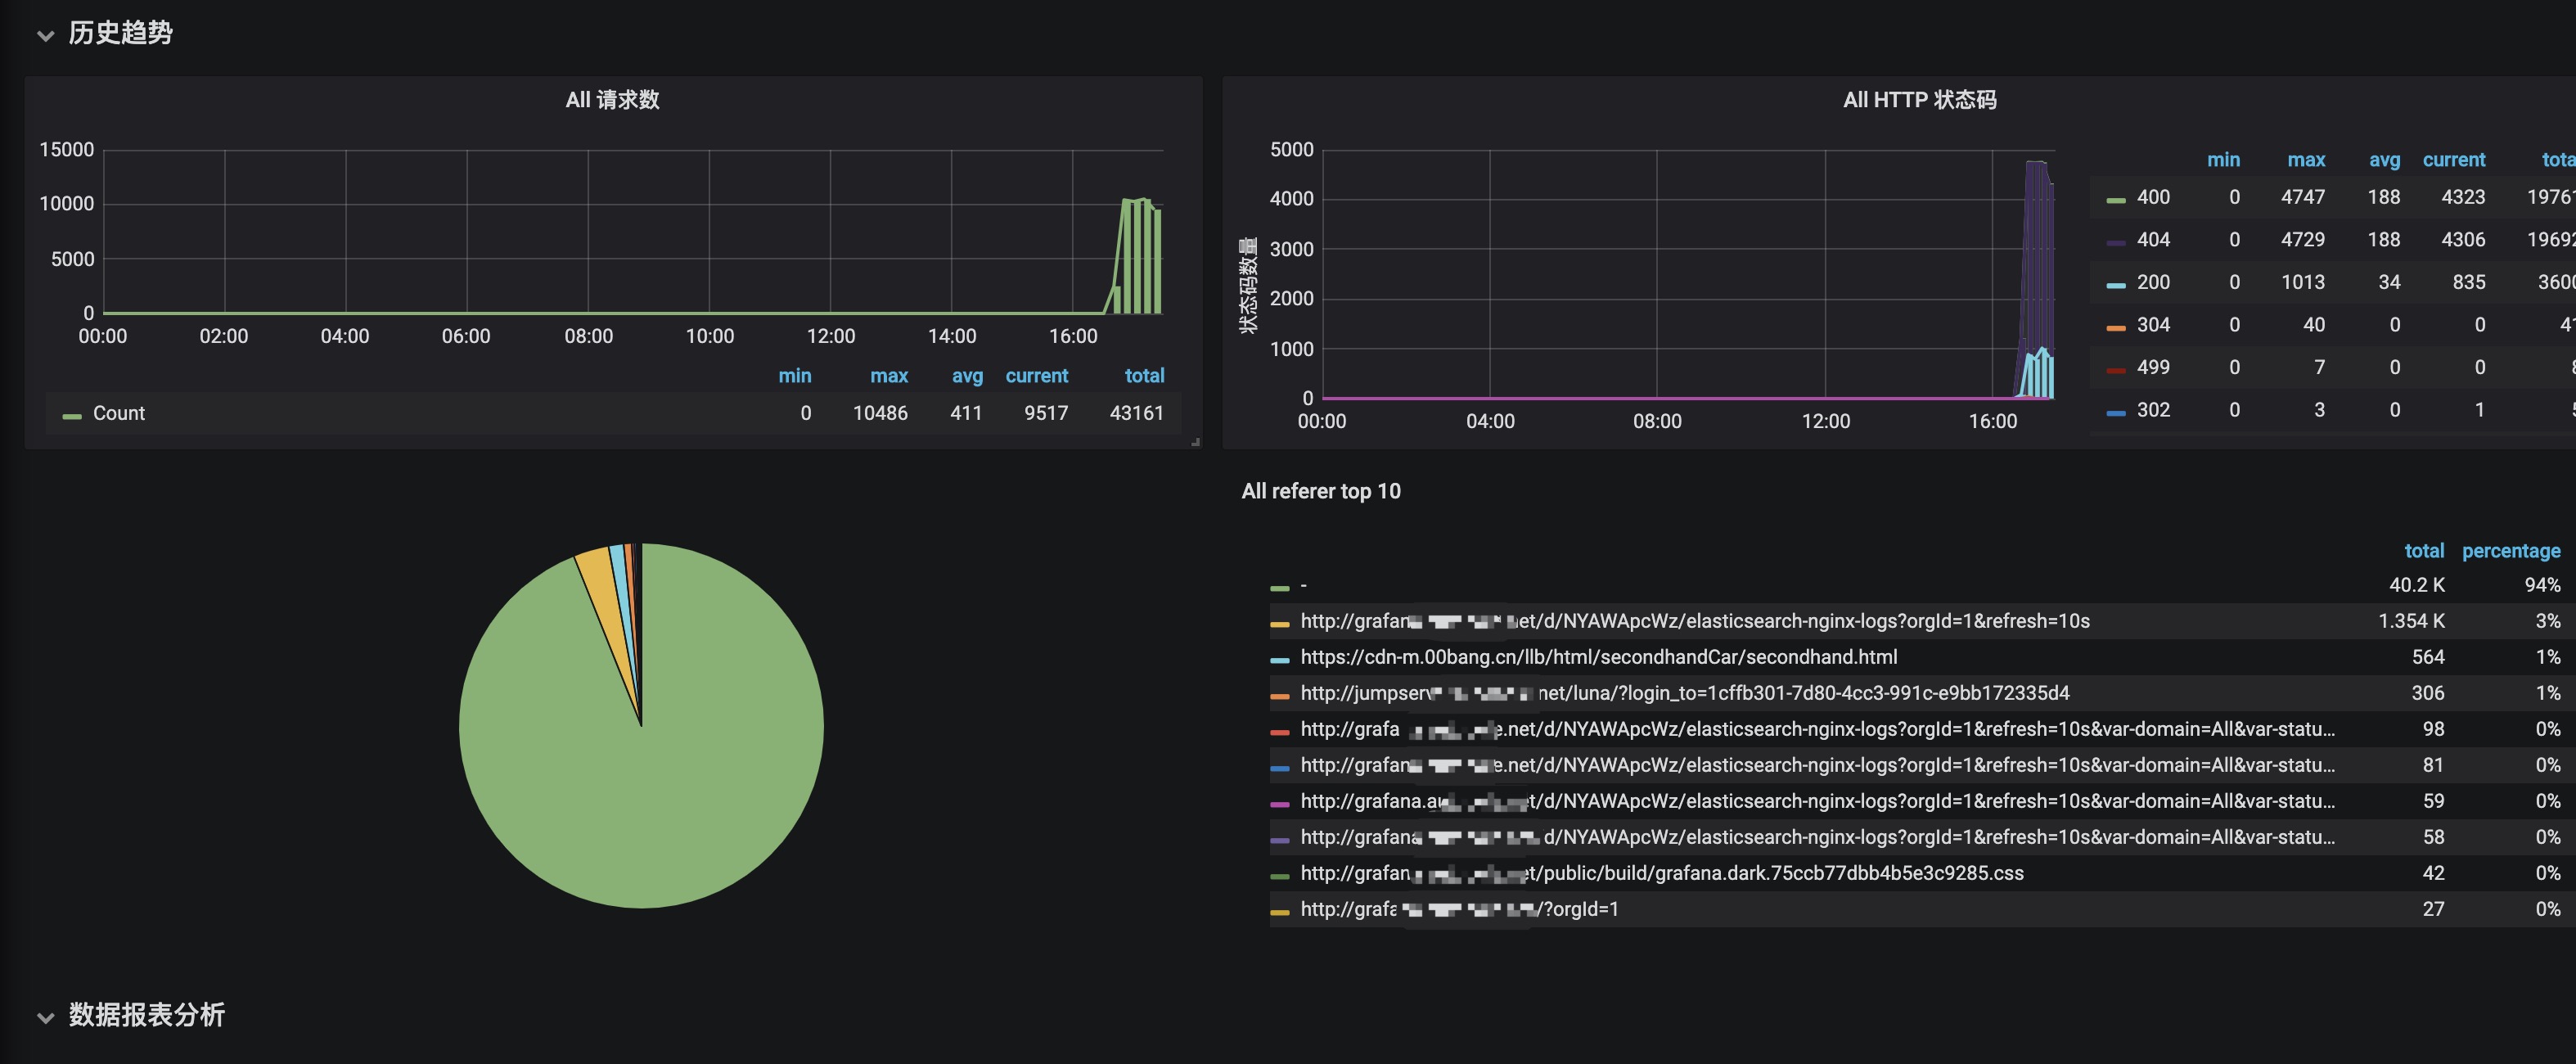
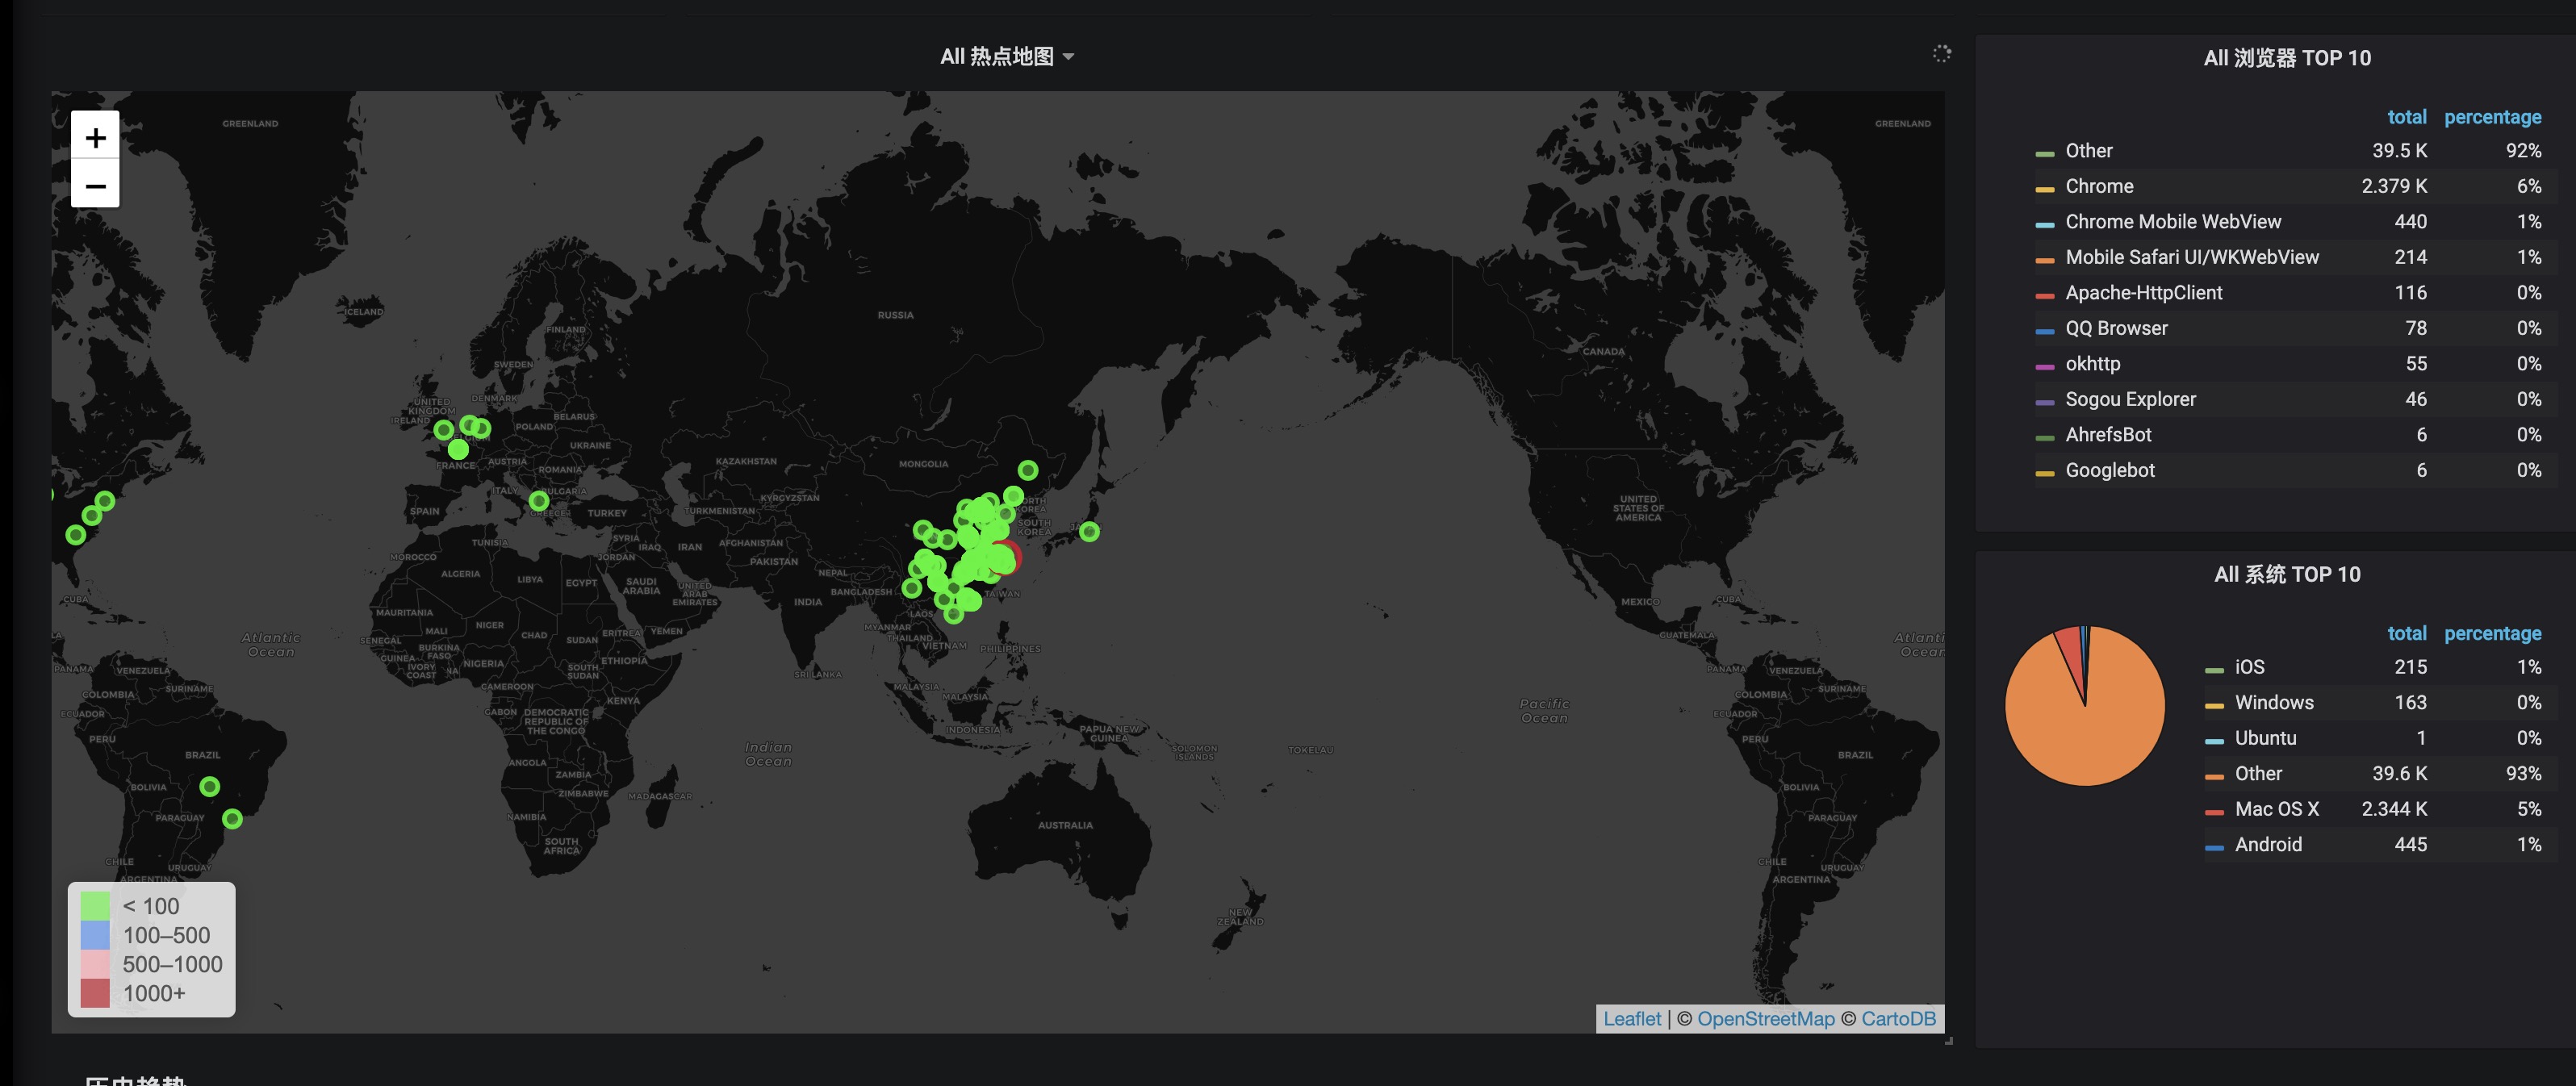
filebear收集数据到redis,然后logstash从redis消费,将日志输出给elasticsearch中
ELK 版本:7.3
修改nginx配置
######## Obtain IP and domain name and write to log ########
  log_format aka_logs
    '{"@timestamp":"$time_iso8601",'
    '"domain":"$host",'
    '"server_ip":"$server_addr",'
    '"client_ip":"$remote_addr",'
    '"size":"$body_bytes_sent",'
    '"responsetime":"$request_time",'
    '"upstreamtime":"$upstream_response_time",'
    '"request_method":"$request_method",'
    '"url":"$uri",'
    '"http_user_agent":"$http_user_agent",'
    '"status":"$status",'
    '"referer":"$http_referer"'
  '}';
filebeat 参考配置
#=========================== Filebeat inputs =============================
filebeat.inputs:
# 收集 nginx 日志
- type: log
enabled: true
paths:
- /data/wwwlogs/*_nginx.log
tags: ["nginx_logs"]
# 日志是json开启这个
json.keys_under_root: true
json.overwrite_keys: true
json.add_error_key: true
# 如果值为ture,那么fields存储在输出文档的顶级位置
fields_under_root: true
fields:
logs_type: "nginx_logs"
收集 tomcat 日志
-
type: log
enabled: true
paths:
- /data/wwwroot/dd-formal/logs/catalina.out
tags: ["tomcat_logs"]
fields_under_root: true
fields:
logs_type: "dd"
-
type: log
enabled: true
paths:
- /data/wwwroot/cc-formal/logs/catalina.out
tags: ["tomcat_logs"]
fields_under_root: true
fields:
logs_type: "cc"
-
type: log
enabled: true
paths:
- /data/wwwroot/bb-formal/logs/catalina.out
tags: ["tomcat_logs"]
fields_under_root: true
fields:
logs_type: "bb"
-
type: log
enabled: true
paths:
- /data/wwwroot/aa-formal/logs/catalina.out
tags: ["tomcat_logs"]
fields_under_root: true
fields:
logs_type: "aa"
#设置删除不必要的字段
processors:
- drop_fields:
fields: [ "ecs","agent","host","cloud","@version" ]
#============================= Filebeat modules ===============================
filebeat.config.modules:
Glob pattern for configuration loading
path: ${path.config}/modules.d/*.yml
Set to true to enable config reloading
reload.enabled: false
Period on which files under path should be checked for changes
#reload.period: 10s
#==================== Elasticsearch template setting ==========================
setup.template.settings:
index.number_of_shards: 3
#index.codec: best_compression
#_source.enabled: false
#————————– Redis output ——————————
output.redis:
hosts: ["172.16.8.74:6379"] #输出到redis的机器
password: "password"
key: "bole-tomcat_logs" #redis中日志数据的key值ֵ
db: 0
timeout: 5
keys:
- key: "bole-nginx_logs"
when.contains:
logs_type: "nginx_logs"
#================================ Processors =====================================
Configure processors to enhance or manipulate events generated by the beat.
processors:
- add_host_metadata: ~
- add_cloud_metadata: ~
logstash 参考配置
### logstash
input {
  # bole-nginx
  redis {
    data_type =>"list"
    key =>"bole-nginx_logs"
    host =>"redis"
    port => 6379
    password => "password"
    db => 0
    type => nginx_logs
  }
master-tomcat
redis {
data_type =>"list"
key =>"bole-tomcat_logs"
host =>"redis"
port => 6379
password => "password"
db => 0
type => tomcat_logs
}
}
filter {
if [type] in "nginx_logs" {
geoip {
#multiLang => "zh-CN"
target => "geoip"
source => "client_ip"
#database => "/opt/logstash-7.3.1/GeoLite2-City.mmdb"
database => "/usr/share/logstash/GeoLite2-City.mmdb"
add_field => [ "[geoip][coordinates]", "%{[geoip][longitude]}" ]
add_field => [ "[geoip][coordinates]", "%{[geoip][latitude]}" ]
# 去掉显示 geoip 显示的多余信息
remove_field => ["[geoip][latitude]", "[geoip][longitude]", "[geoip][country_code]", "[geoip][country_code2]", "[geoip][country_code3]", "[geoip][timezone]", "[geoip][continent_code]", "[geoip][region_code]"]
}
mutate {
convert => [ "size", "integer" ]
convert => [ "status", "integer" ]
convert => [ "responsetime", "float" ]
convert => [ "upstreamtime", "float" ]
convert => [ "[geoip][coordinates]", "float" ]
# 过滤 filebeat 没用的字段,这里过滤的字段要考虑好输出到es的,否则过滤了就没法做判断
remove_field => [ "ecs","agent","host","cloud","@version","input","logs_type" ]
}
# 根据http_user_agent来自动处理区分用户客户端系统与版本
useragent {
source => "http_user_agent"
target => "ua"
# 过滤useragent没用的字段
remove_field => [ "[ua][minor]","[ua][major]","[ua][build]","[ua][patch]","[ua][os_minor]","[ua][os_major]" ]
}
}
if [type] in "tomcat_logs" {
grok {
match => { "message" => "%{TIMESTAMP_ISO8601:access_time}\s+[(?<level>[\s\S])]\s+[%{DATA:exception_info}](?<content>[\s\S])" }
}
date {
match => [ "access_time","MMM  d HH:mm:ss", "MMM dd HH:mm:ss", "ISO8601"]
}
mutate {
# 过滤 filebeat 没用的字段,这里过滤的字段要考虑好输出到es的,否则过滤了就没法做判断
remove_field => [ "ecs","agent","host","cloud","@version","message","input" ]
}
}
}
output {
收集服务器 nginx 日志
if [type] in "nginx_logs" {
elasticsearch {
hosts => "es-master"
user => "elastic"
password => "password"
index => "logstash-nginx-%{+YYYY.MM.dd}"
}
}
收集服务器 tomcat 日志
if [type] in "tomcat_logs" {
elasticsearch {
hosts => "es-master"
user => "elastic"
password => "password"
index => "logstash-tomcat-%{+YYYY.MM.dd}"
}
}
}
Data source config
Collector config:
Upload an updated version of an exported dashboard.json file from Grafana
| Revision | Description | Created | |
|---|---|---|---|
| Download |
NGINX
Easily monitor NGINX, an open source software for web serving, reverse proxying, caching, load balancing, media streaming, and more, with Grafana Cloud's out-of-the-box monitoring solution.
Learn more