Prometheus Alerts
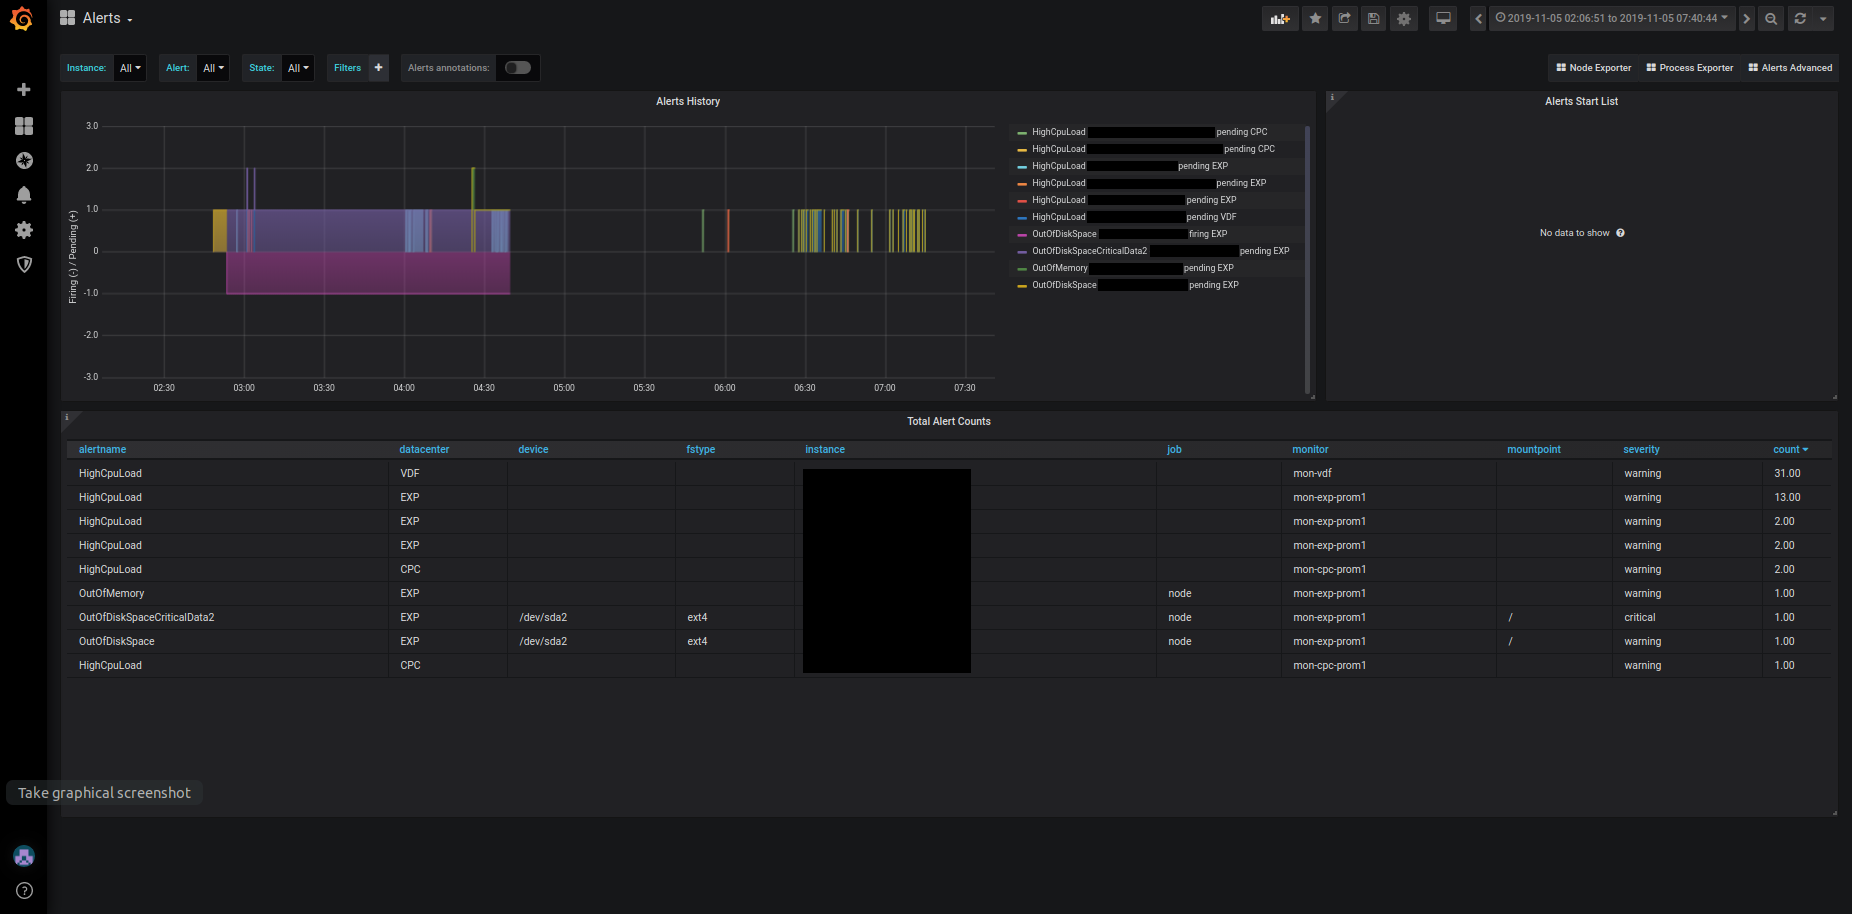
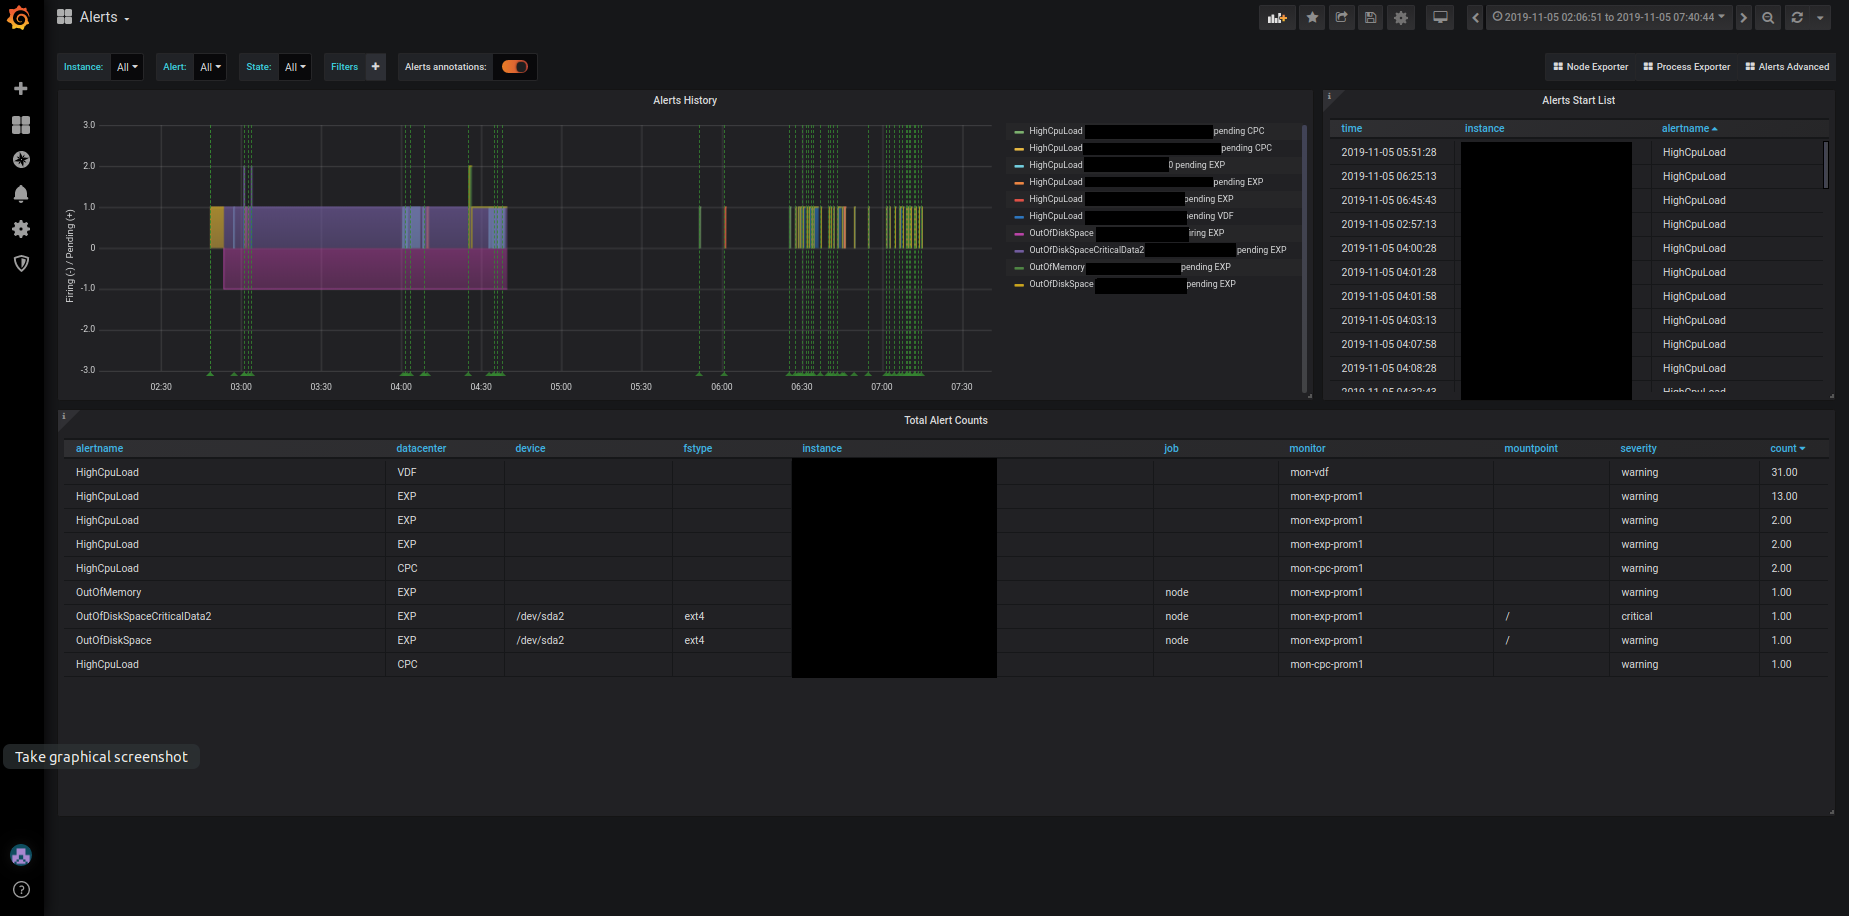
Dashboard showing Prometheus Alerts (both pending and firing) for alerts adjustment and debugging
Purpose:
The dashboard shows the history of all alerts from the Prometheus ALERTS metric (both pending and firing), together with their counts. This can be used for alerts adjustments and debugging (the user has an overview of what pending alerts occurred recently and when).
Used metrics:
The dashboard uses two synthetic Prometheus time series: ALERTS and ALERTS_FOR_STATE
Dependencies:
Prometheus 2.4.0 (added ALERTS_FOR_STATE metric)
Data source config
Collector config:
Upload an updated version of an exported dashboard.json file from Grafana
| Revision | Description | Created | |
|---|---|---|---|
| Download |
Metrics Endpoint (Prometheus)
Easily monitor any Prometheus-compatible and publicly accessible metrics URL with Grafana Cloud's out-of-the-box monitoring solution.
Learn more