InfluxDB Internals Dashboard
InfluxDB internal metrics display. It is a comprehensive dashboard of 124 panels that gives you a detailed understanding of your influx DB.
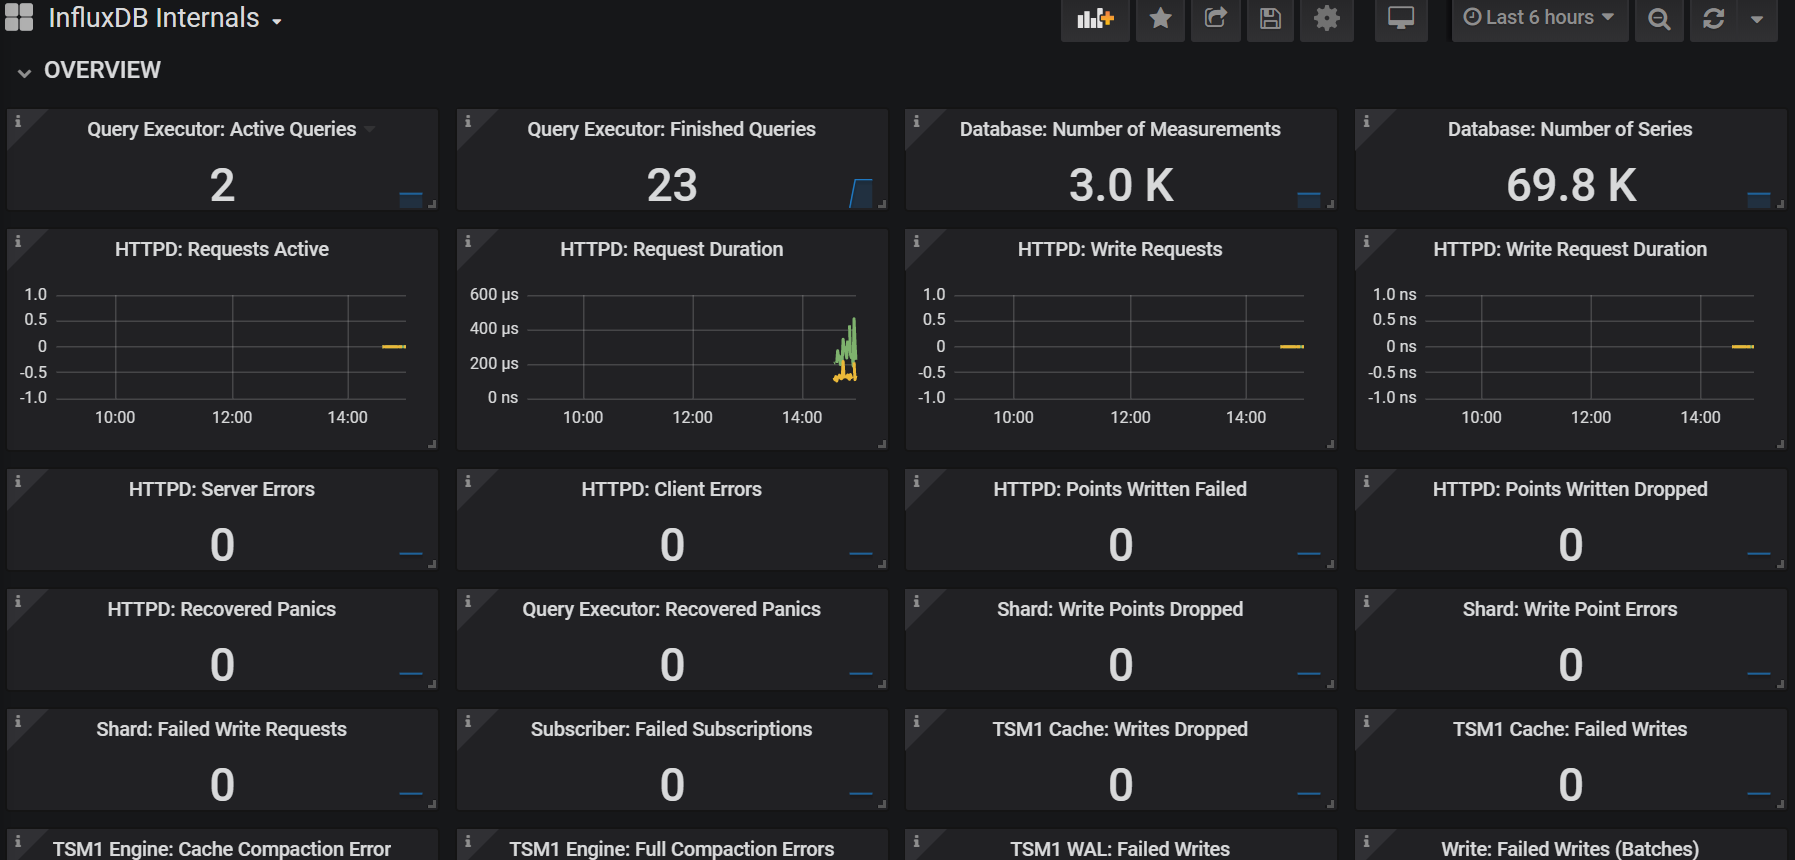
This dashboard was developed by Mike Holloway (MH720) and Bishvesh Pachauli (bishvesh) to get an in-depth understanding of a running influx DB environment. This dashboard has 13 rows and 124 panels. From HTTPD queries, to continuous queries, and from TSM cache to shards, this dashboard will monitor possibly every metric that the influx db engine throws. This dashboard has 13 rows and 124 panels.
Data source config
Collector type:
Collector plugins:
Collector config:
Revisions
Upload an updated version of an exported dashboard.json file from Grafana
| Revision | Description | Created | |
|---|---|---|---|
| Download |
InfluxDB
Easily monitor InfluxDB, an open source time series database, with Grafana Cloud's out-of-the-box monitoring solution.
Learn more