
Caringo Swarm Gateway Monitoring v6.2.0
Example dashboard to visualize the metrics for Caringo Swarm Gateway v6.2.0 and higher
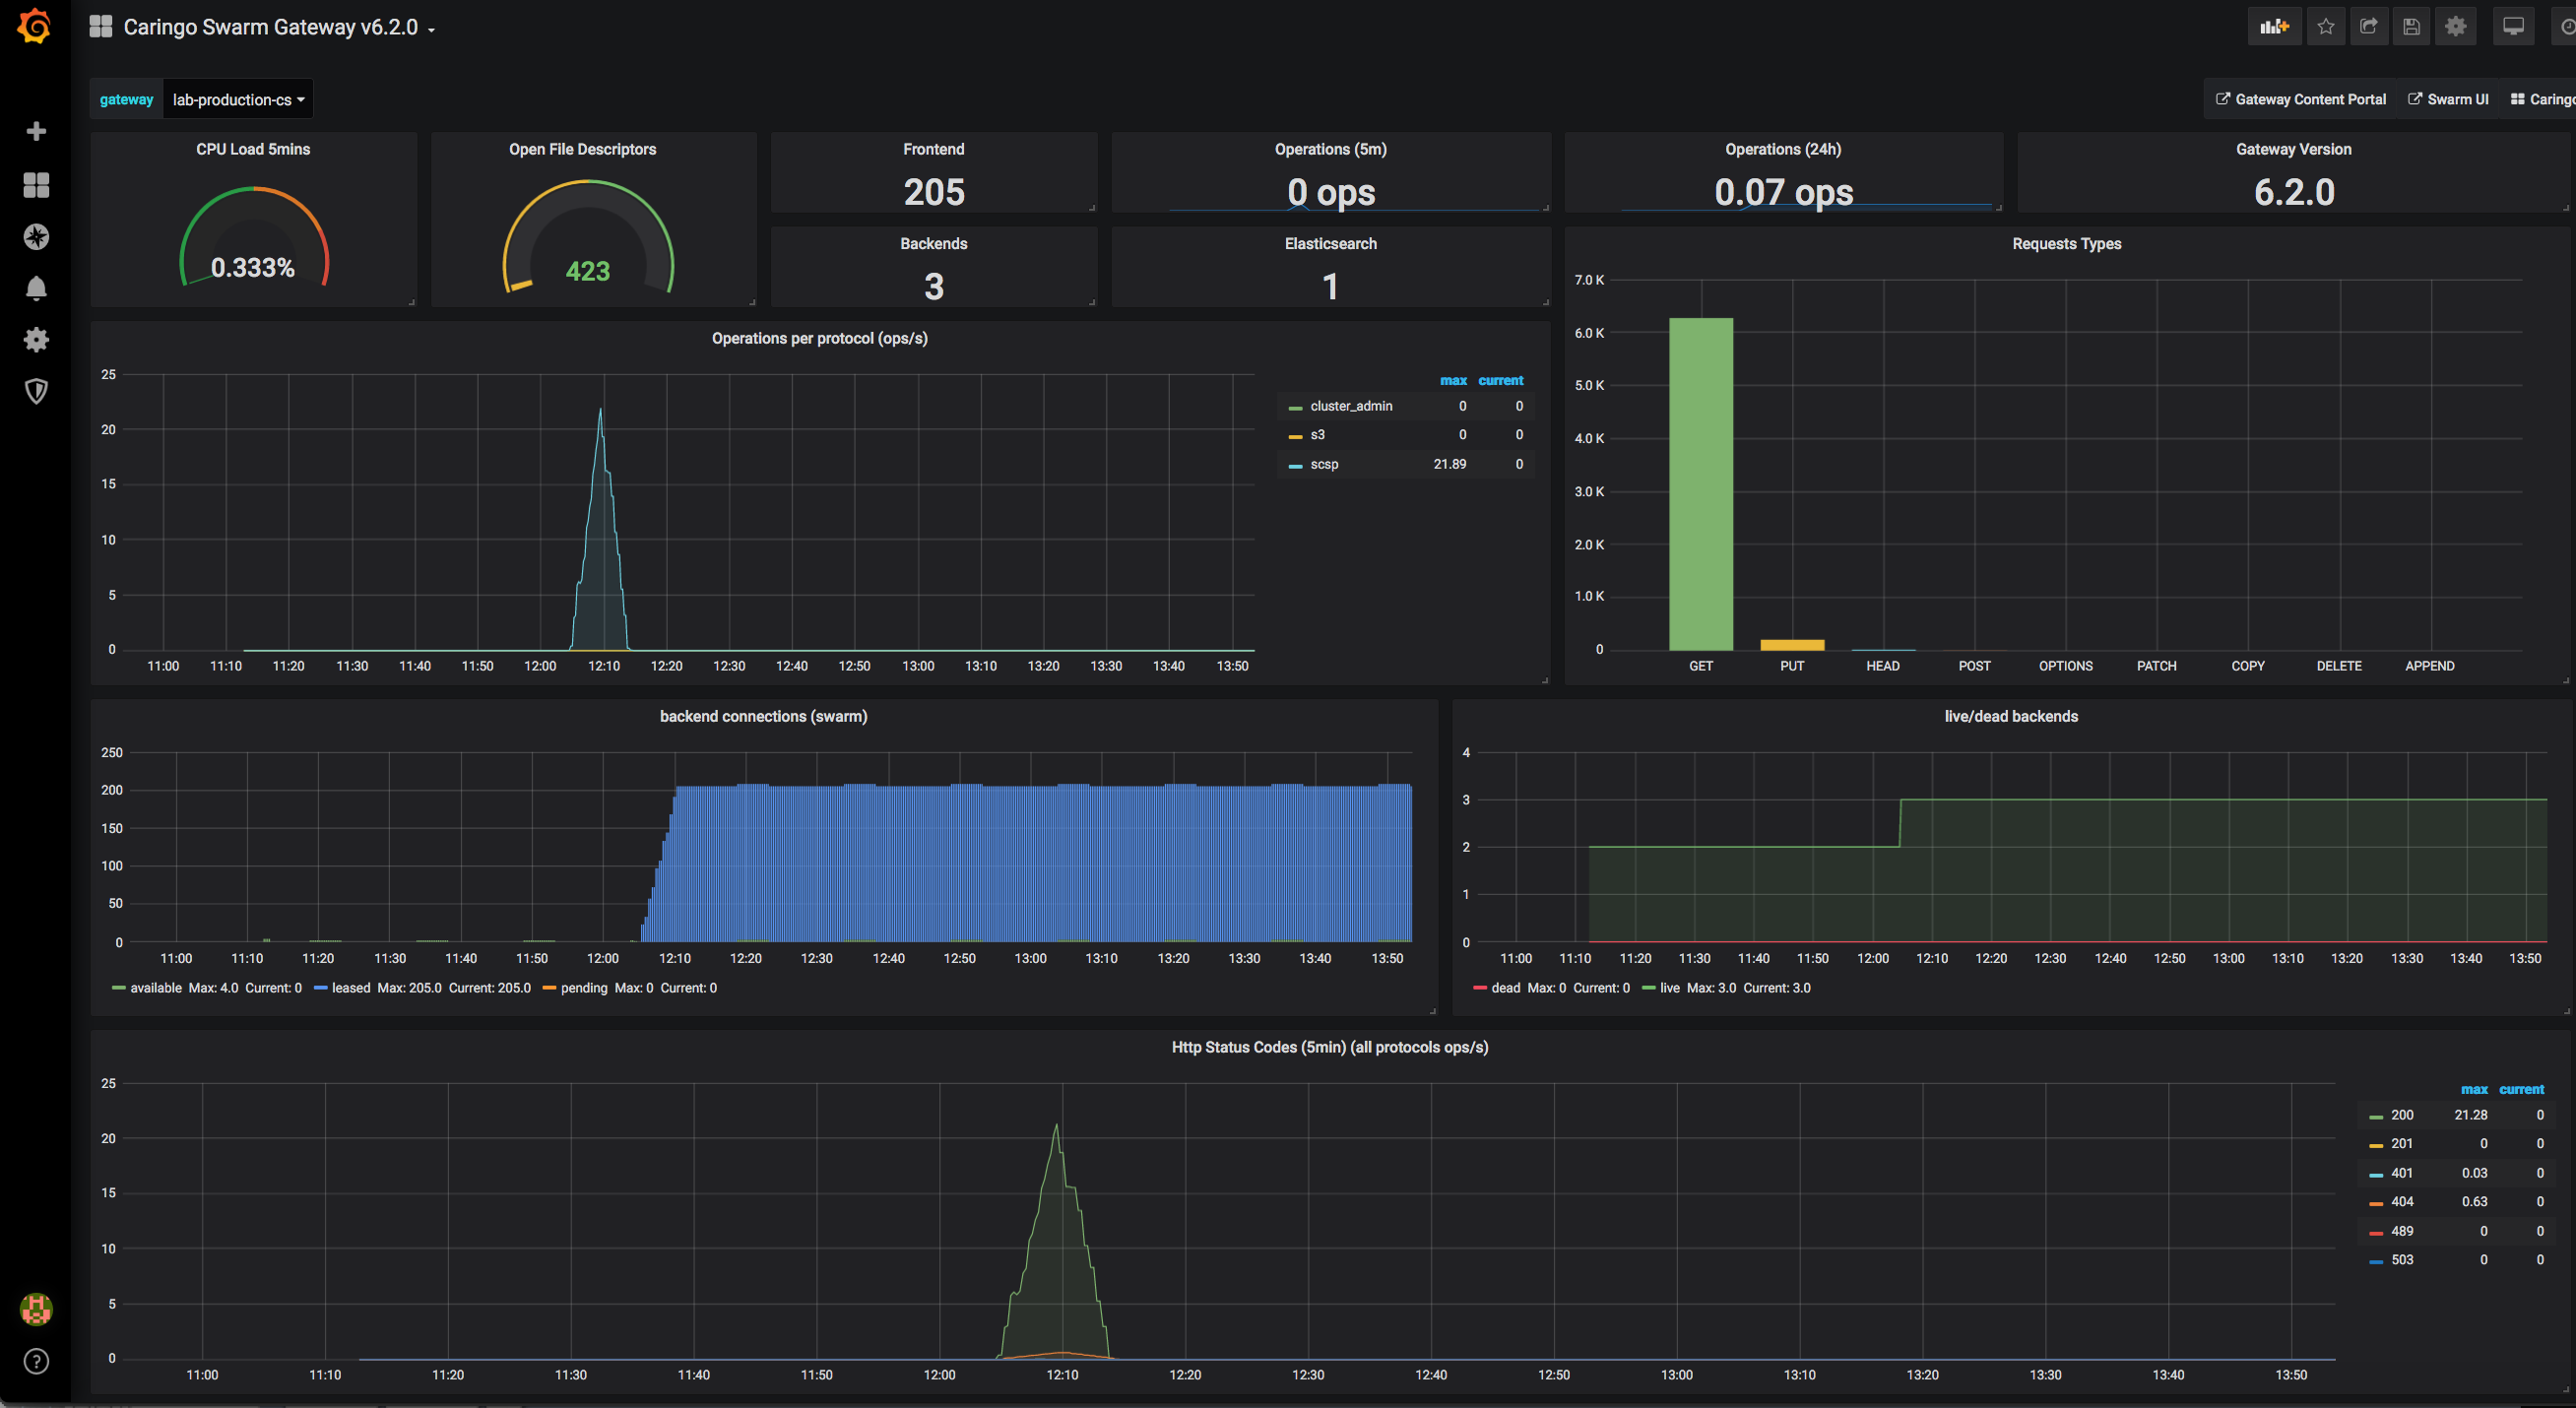
This dashboard is an example of how to visualize metrics provided by Caringo Swarm Content Gateway v6.2.0 and above. Note: some statistics will only show a value once you have done some S3 operations against the gateway.
If you have any questions don’t hesitate to ask us.
The Caringo Team.
Data source config
Collector type:
Collector plugins:
Collector config:
Revisions
Upload an updated version of an exported dashboard.json file from Grafana
| Revision | Description | Created | |
|---|---|---|---|
| Download |