Consul Server
Consul Server Telemetry dashboard. Please make sure open consul telemetry before. https://www.consul.io/docs/agent/options.html#telemetry-prometheus_retention_time
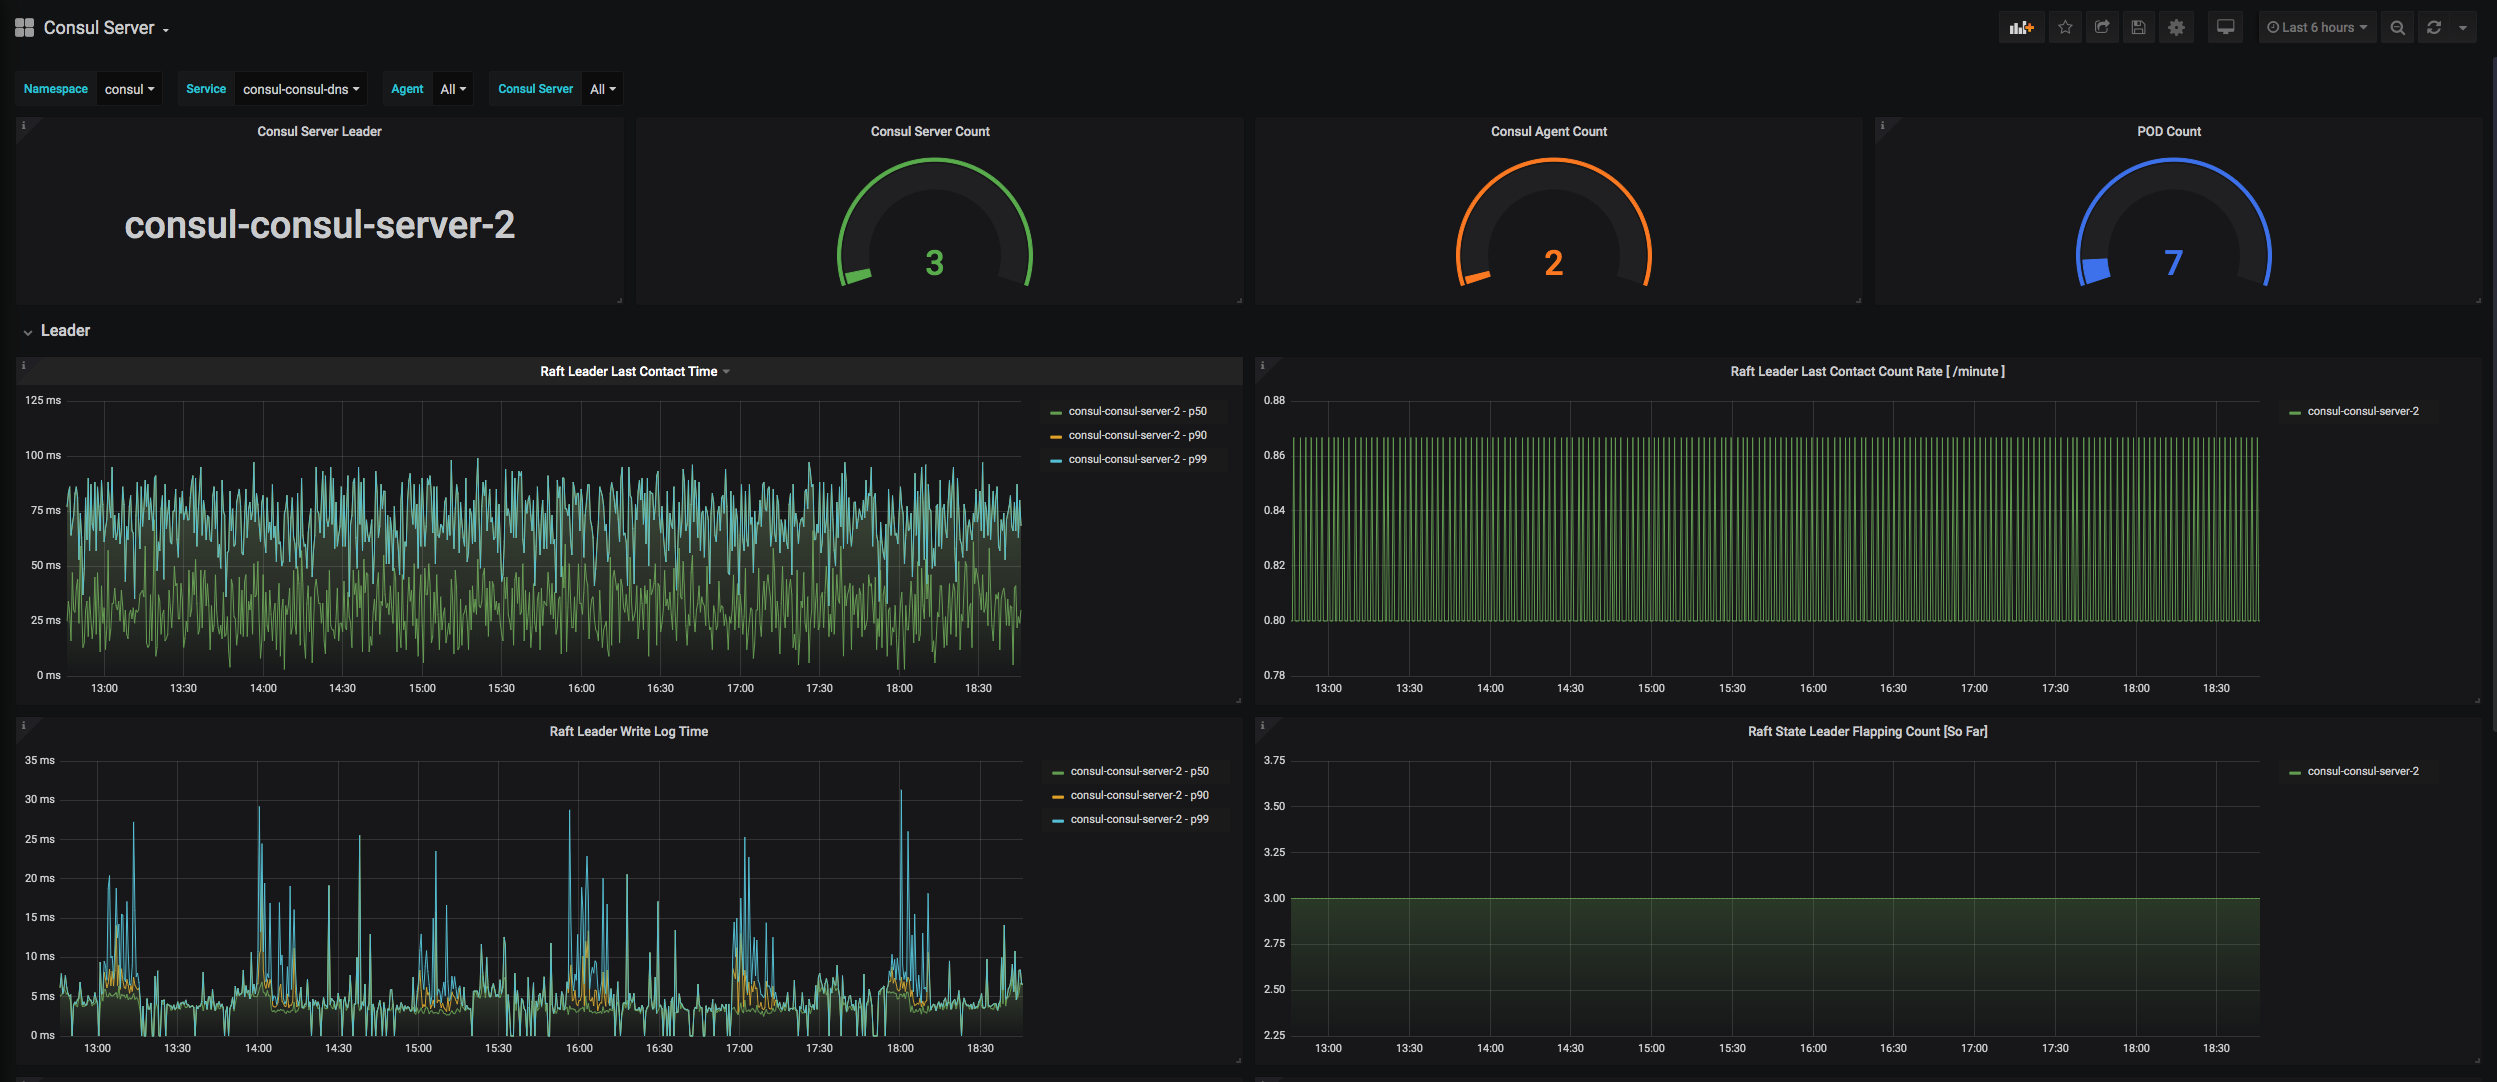
The Consul Server dashboard uses the prometheus data source to create a Grafana dashboard with the gauge, graph, singlestat and table panels.
Data source config
Collector type:
Collector plugins:
Collector config:
Revisions
Upload an updated version of an exported dashboard.json file from Grafana
| Revision | Description | Created | |
|---|---|---|---|
| Download |
Consul
Monitor Consul with Grafana. Easily keep tabs on your service mesh with Grafana Cloud's out-of-the-box monitoring solution.
Learn more