Loki & Promtail
Loki and Promtail metrics.
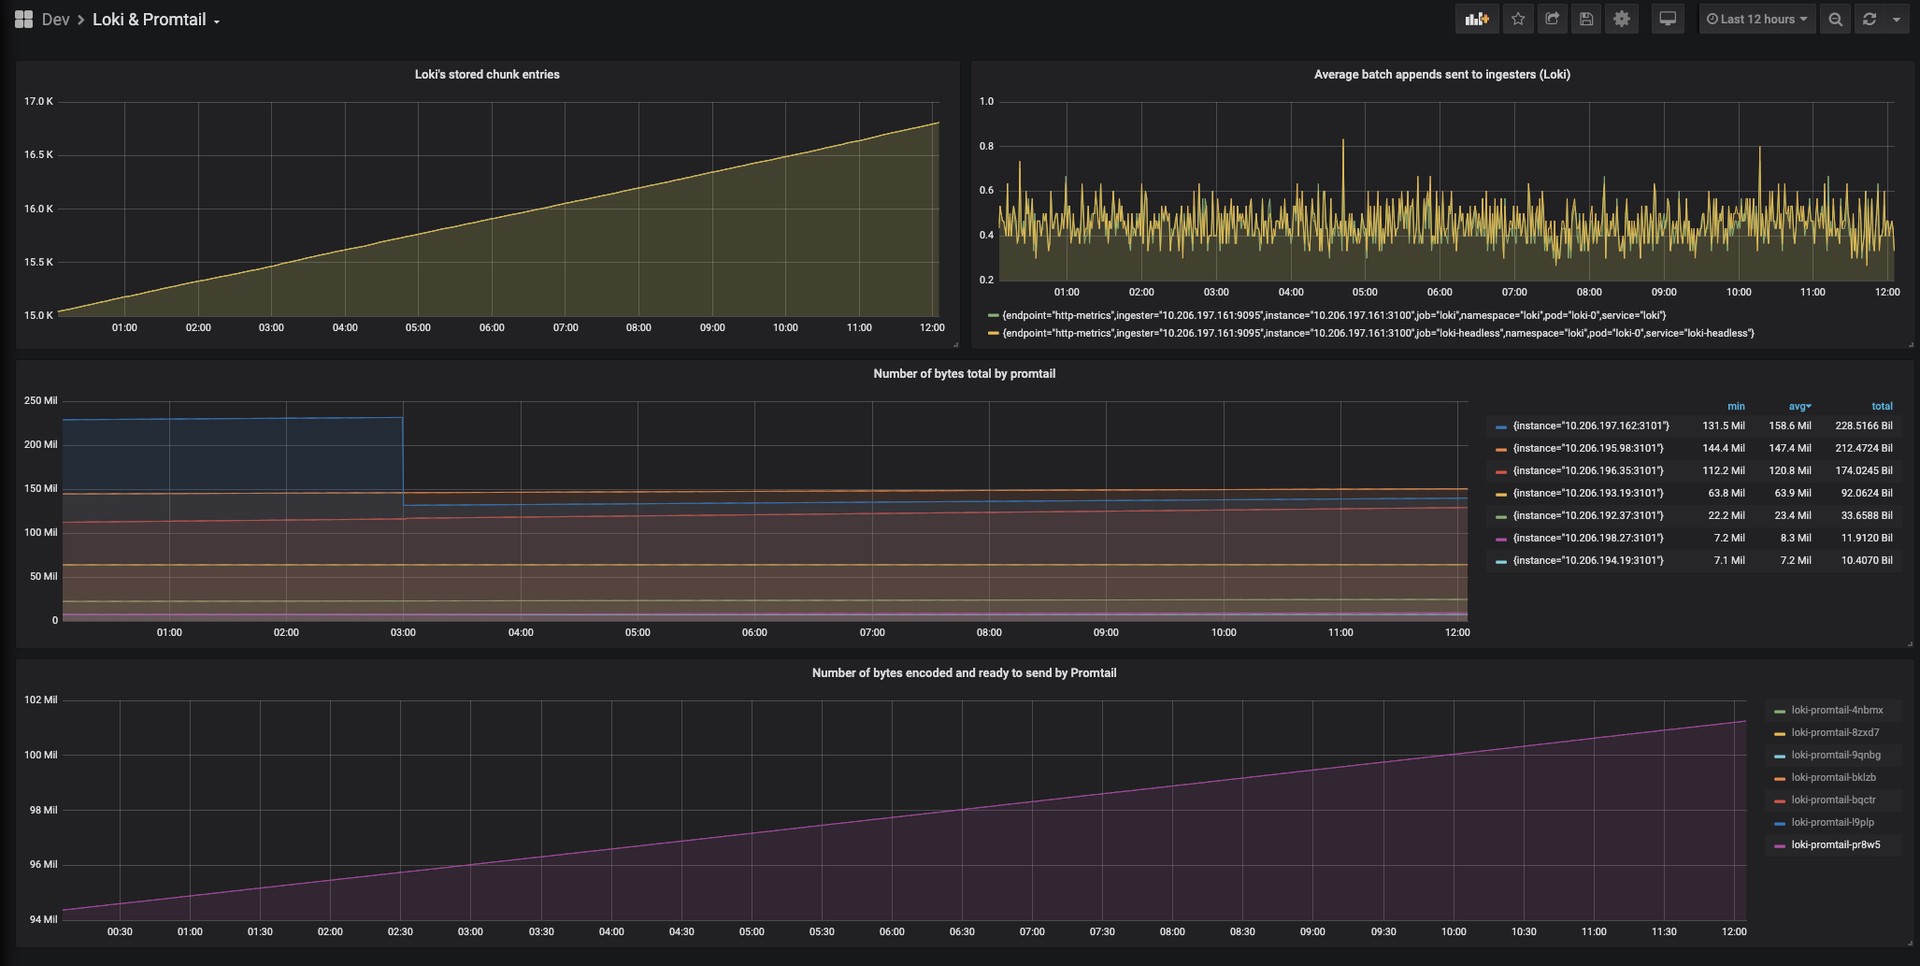
Logs from Promtail and Loki
For getting Promtail and Loki metrics in prometheus you need to scrap them. If you are using prometheus operator and deploying loki-stack with helm chart enable the ServiceMonitor:
loki:
  enabled: true
  serviceMonitor:
    enabled: true
    additionalLabels:
      release: "prometheus"
Data source config
Collector type:
Collector plugins:
Collector config:
Revisions
Upload an updated version of an exported dashboard.json file from Grafana
| Revision | Description | Created | |
|---|---|---|---|
| Download |
Grafana Loki (self-hosted)
Easily monitor Grafana Loki (self-hosted), a horizontally scalable, highly available, multi-tenant log aggregation system inspired by Prometheus, with Grafana Cloud's out-of-the-box monitoring solution.
Learn more