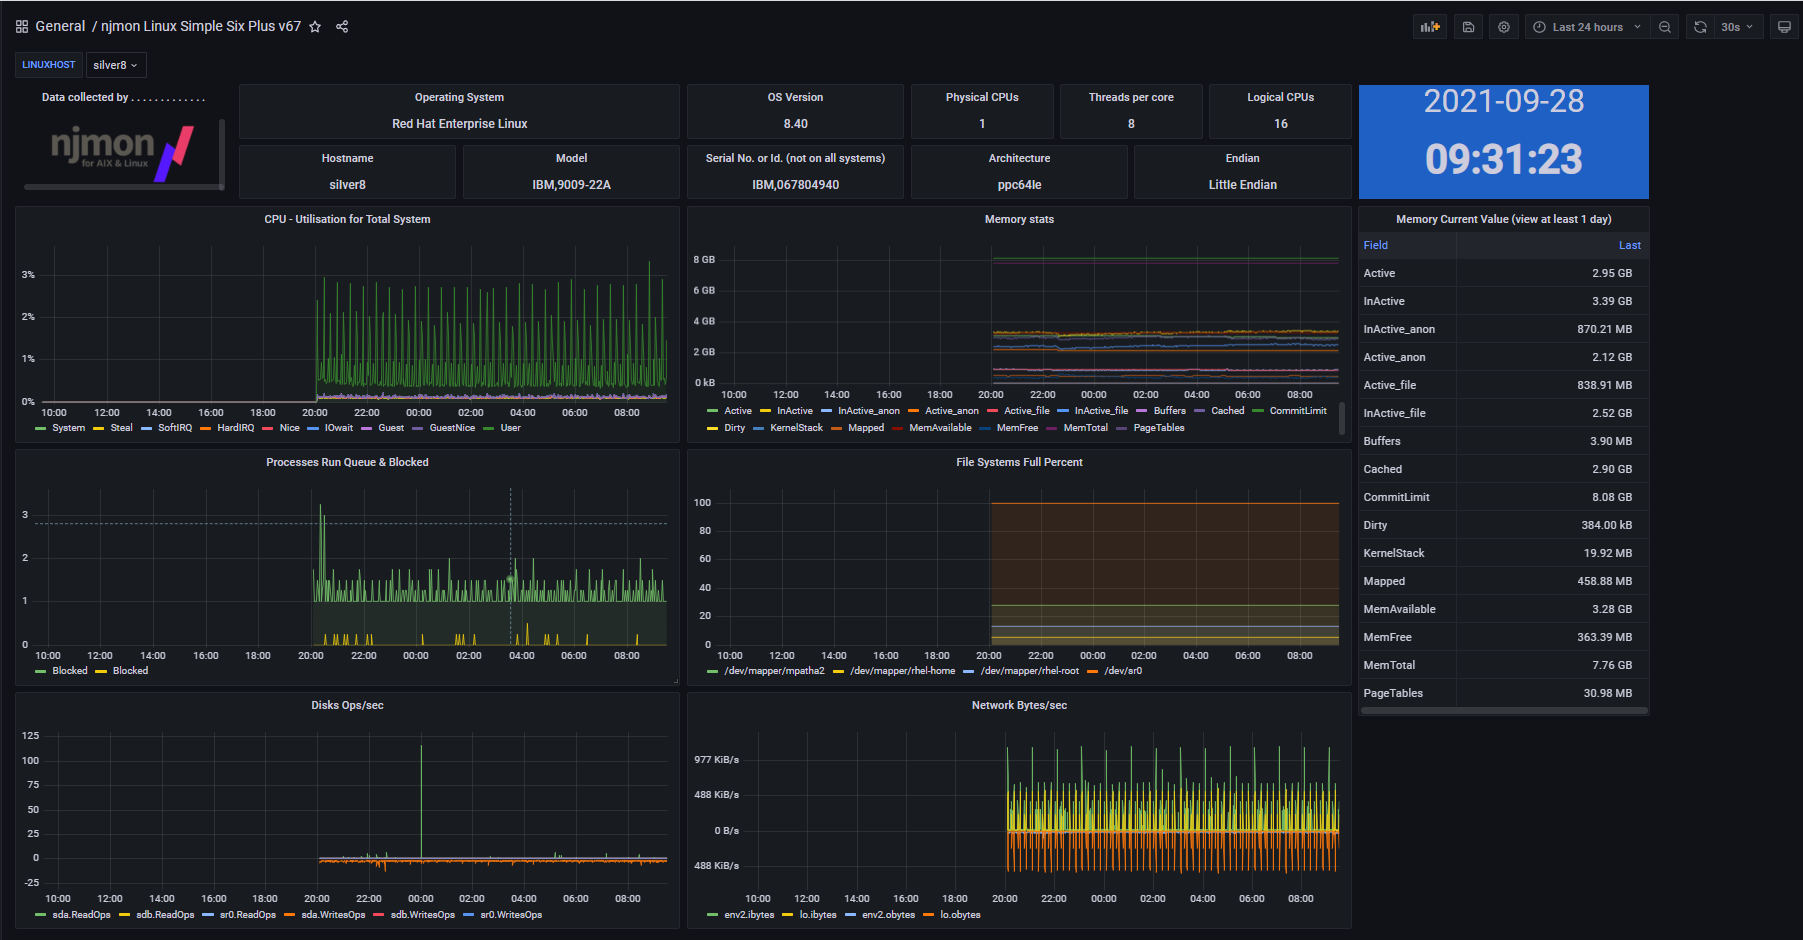
njmon Linux Simple Six Plus v67
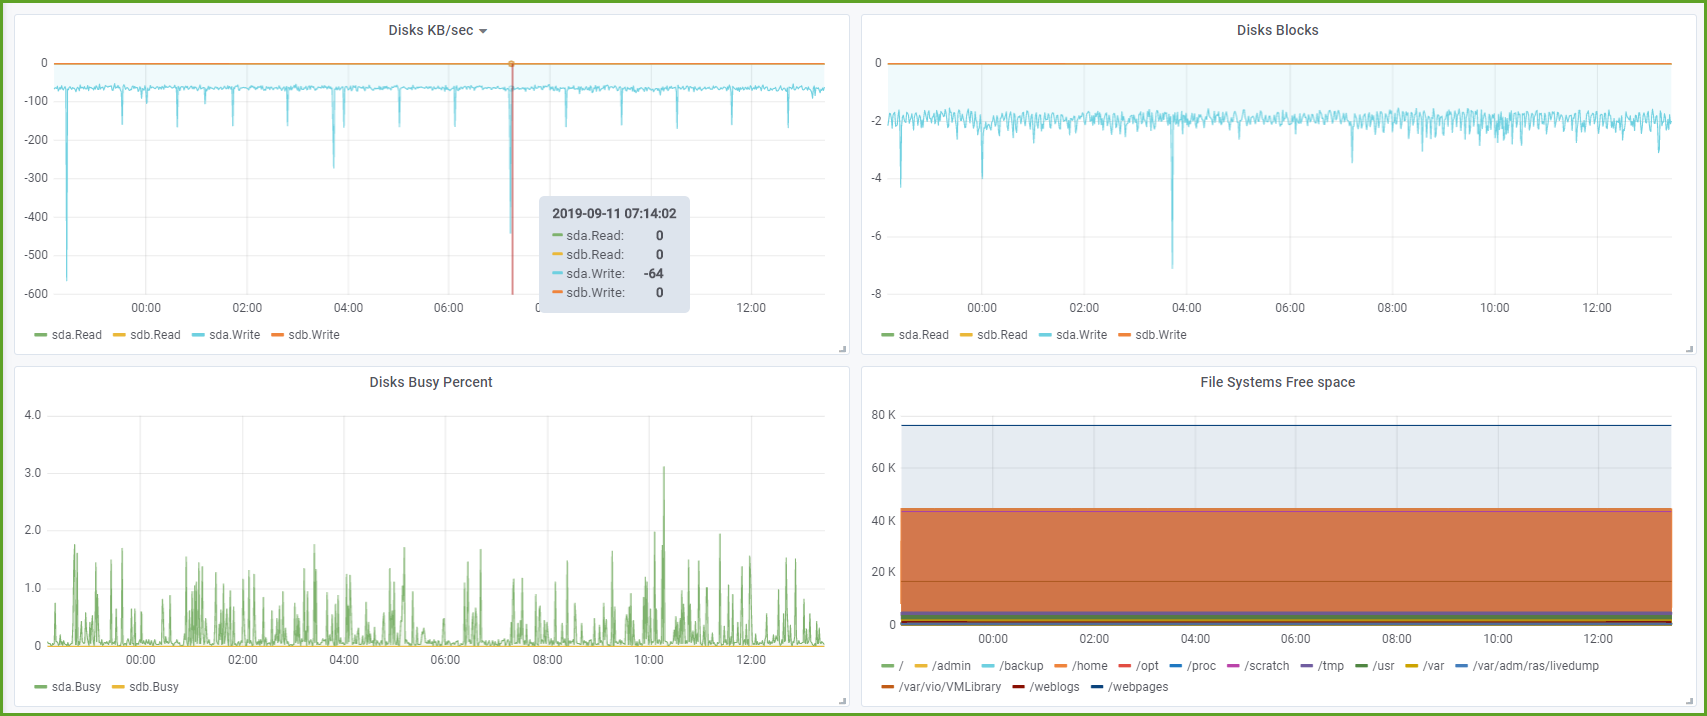
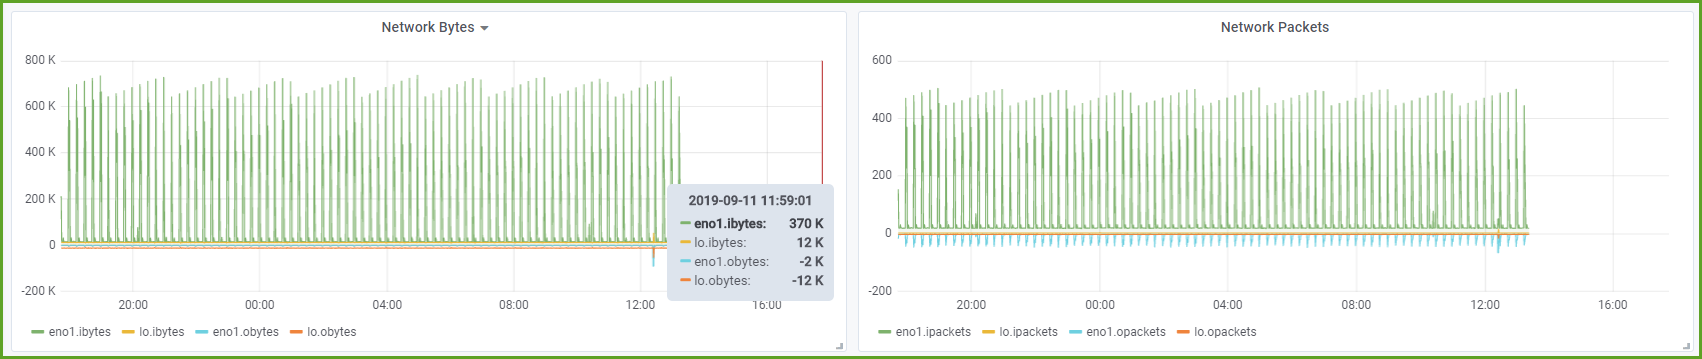
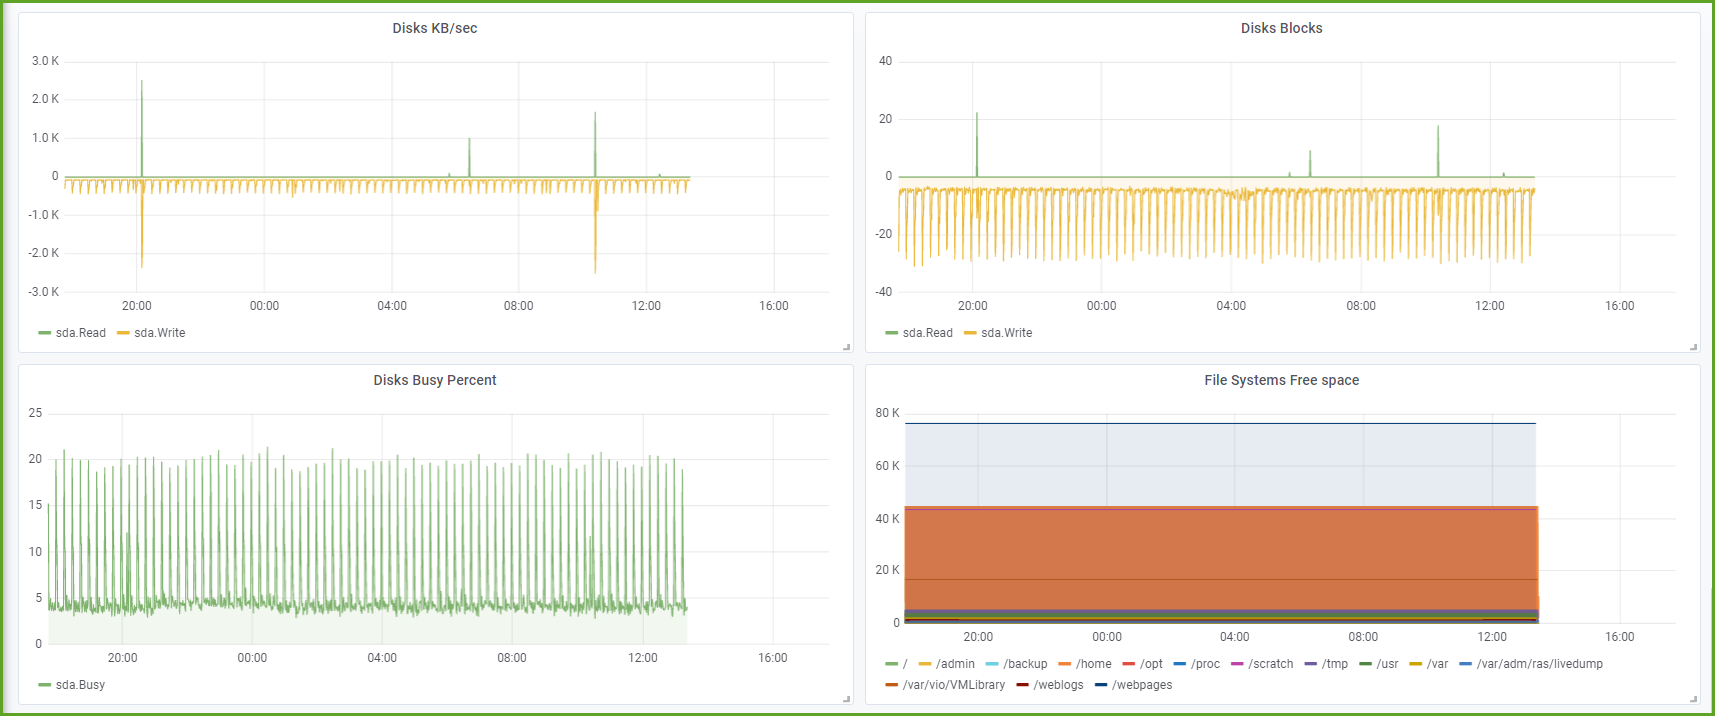
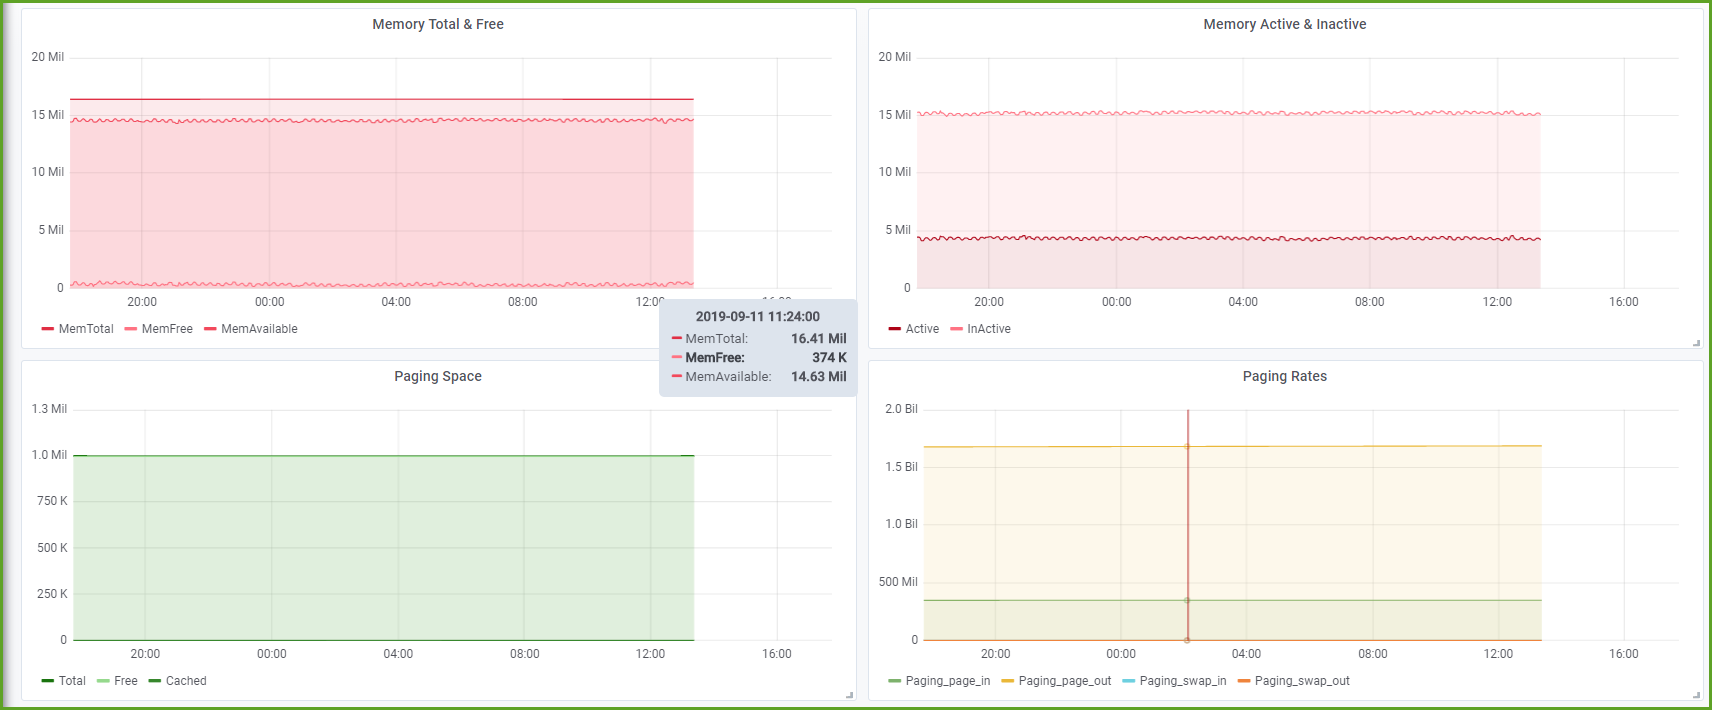
Six graph starter pack (CPU, memory, disk, network, run queue and filesystem) plus basic config details. A simple dashboard to add your own specific more detailed graphs and stats. It requires the clock: Run command: grafana-cli plugins install grafana-clock-panel and restart Grafana. Or just delete that panel if you don't want a clock.
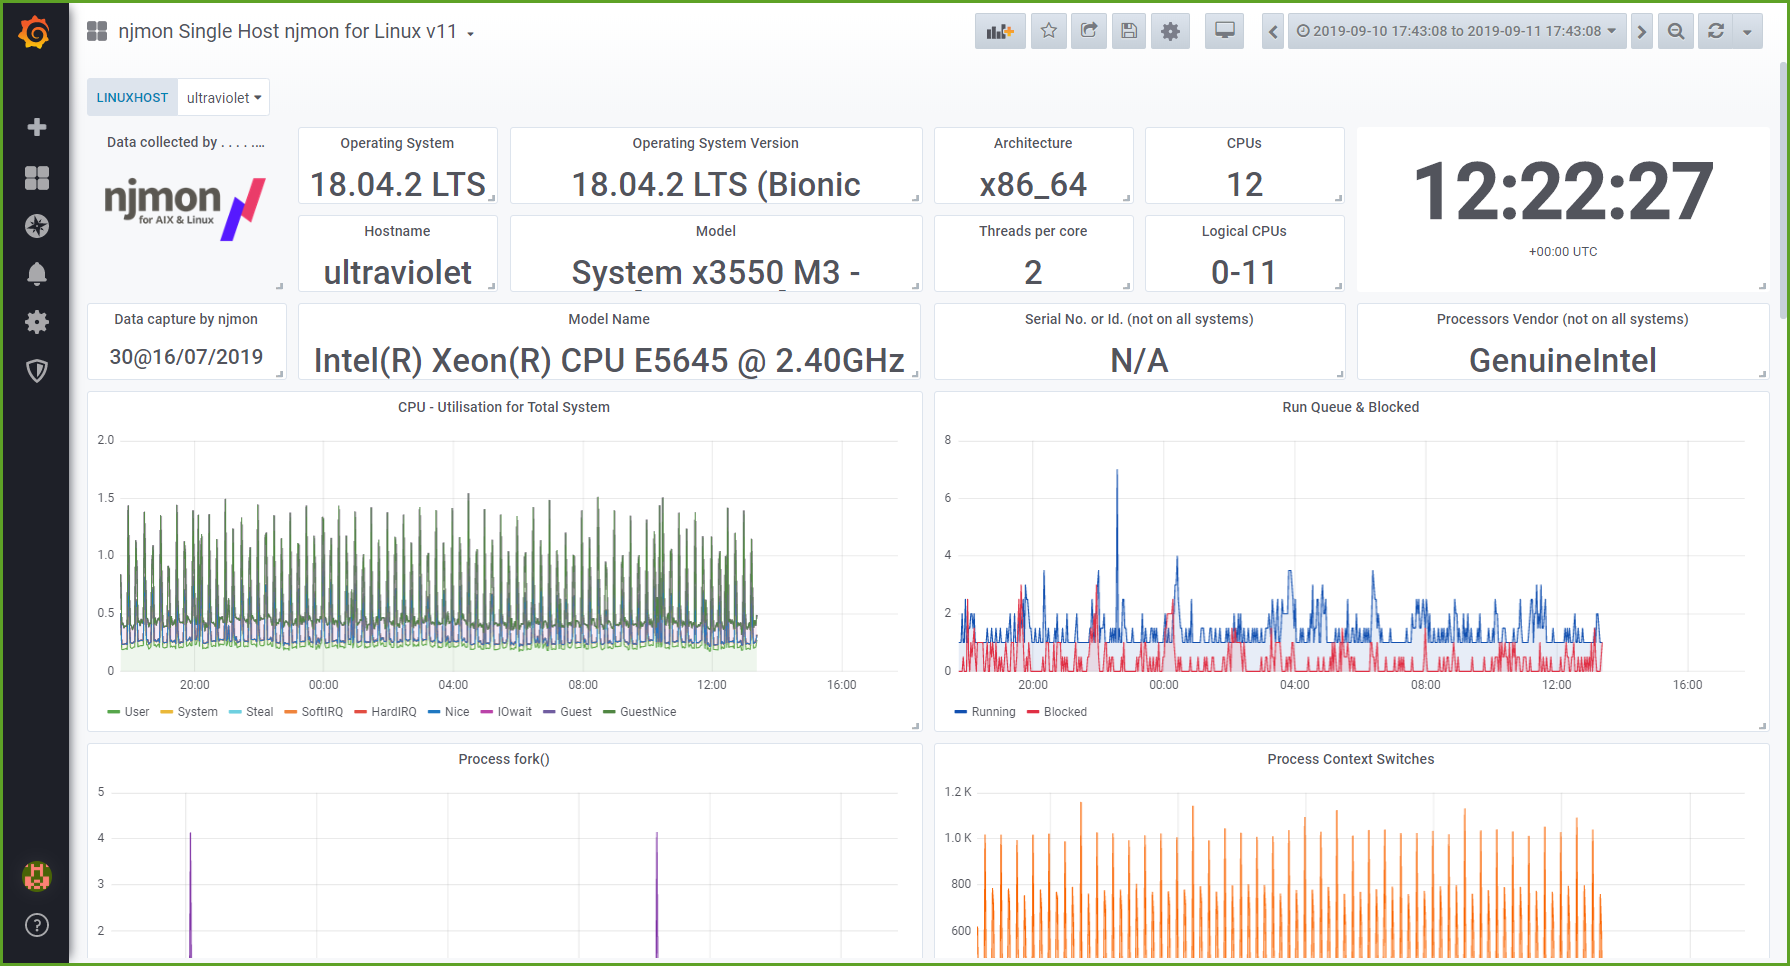
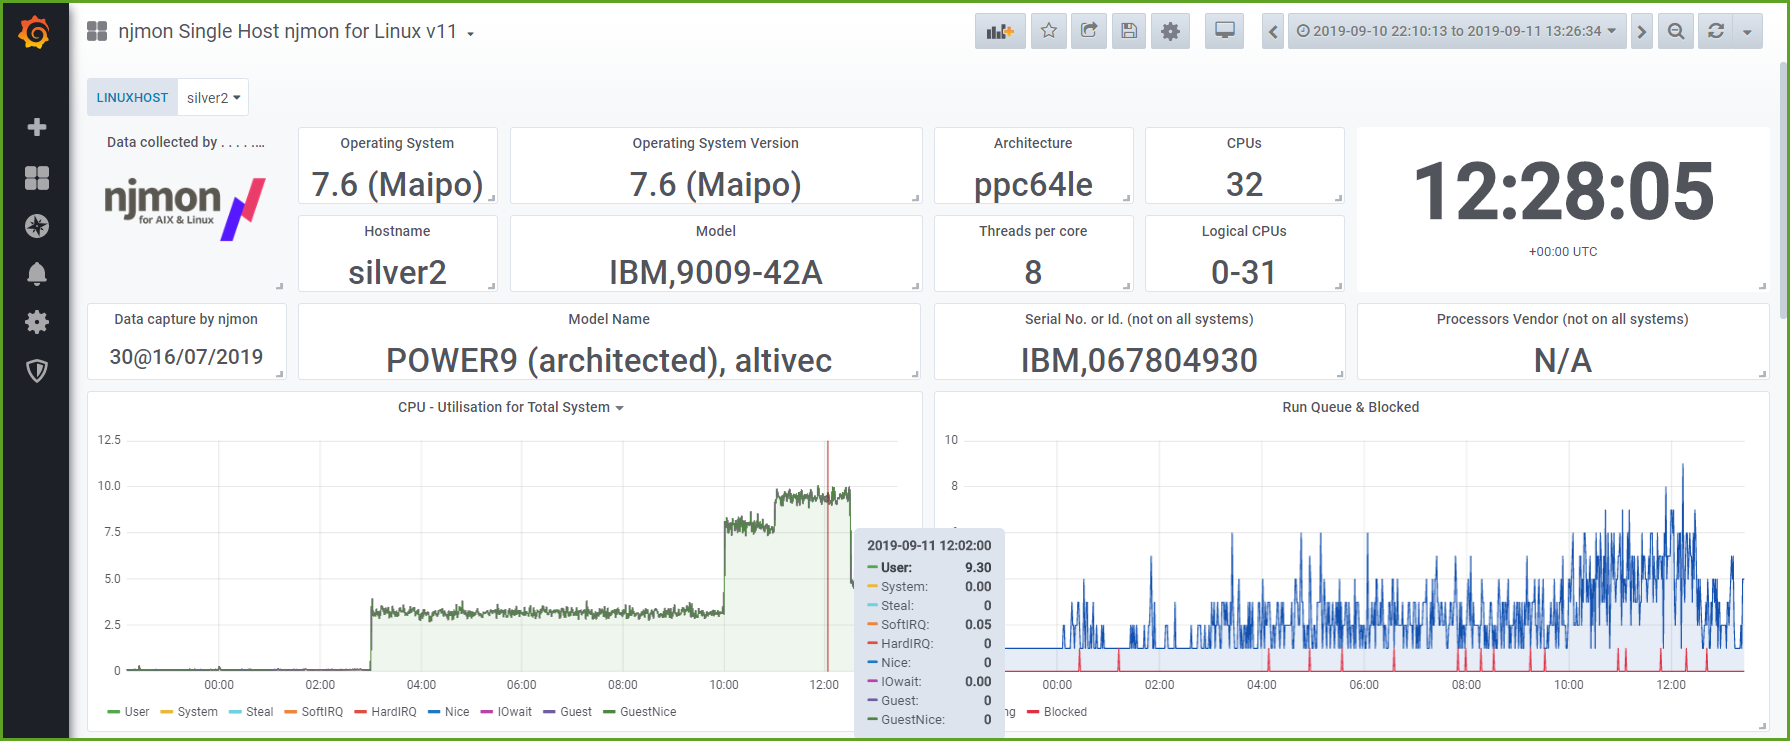
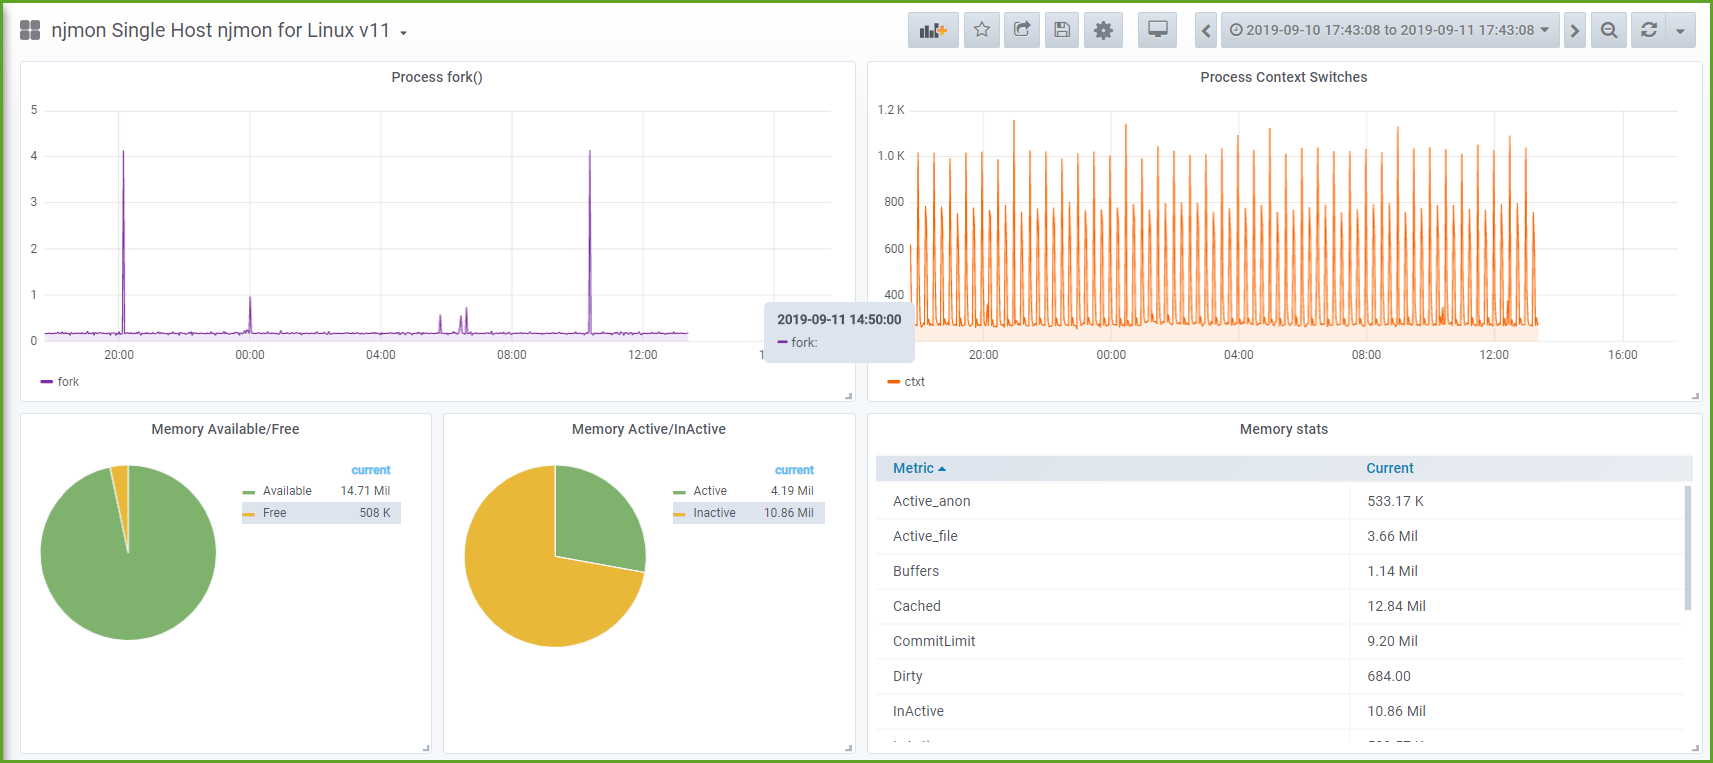
This is using njmon which is a data gather for AIX on POWER, VIOS on POWER and Linux many platforms including AMD64 (x86_64), POWER8/9, ARM=Raspberry Pi and probably IBM Z/zOS. This dashboard works with njmon/nimon for Linux. njmon details, download (open source code too) from http://nmon.sourceforge.net/pmwiki.php?n=Site.Njmon Issues, problems, ideas etc contact me nigelargriffiths@hotmail.com
Data source config
Collector config:
Upload an updated version of an exported dashboard.json file from Grafana
| Revision | Description | Created | |
|---|---|---|---|
| Download |
Linux Server
Monitor Linux with Grafana. Easily monitor your Linux deployment with Grafana Cloud's out-of-the-box monitoring solution.
Learn more