Jiralert
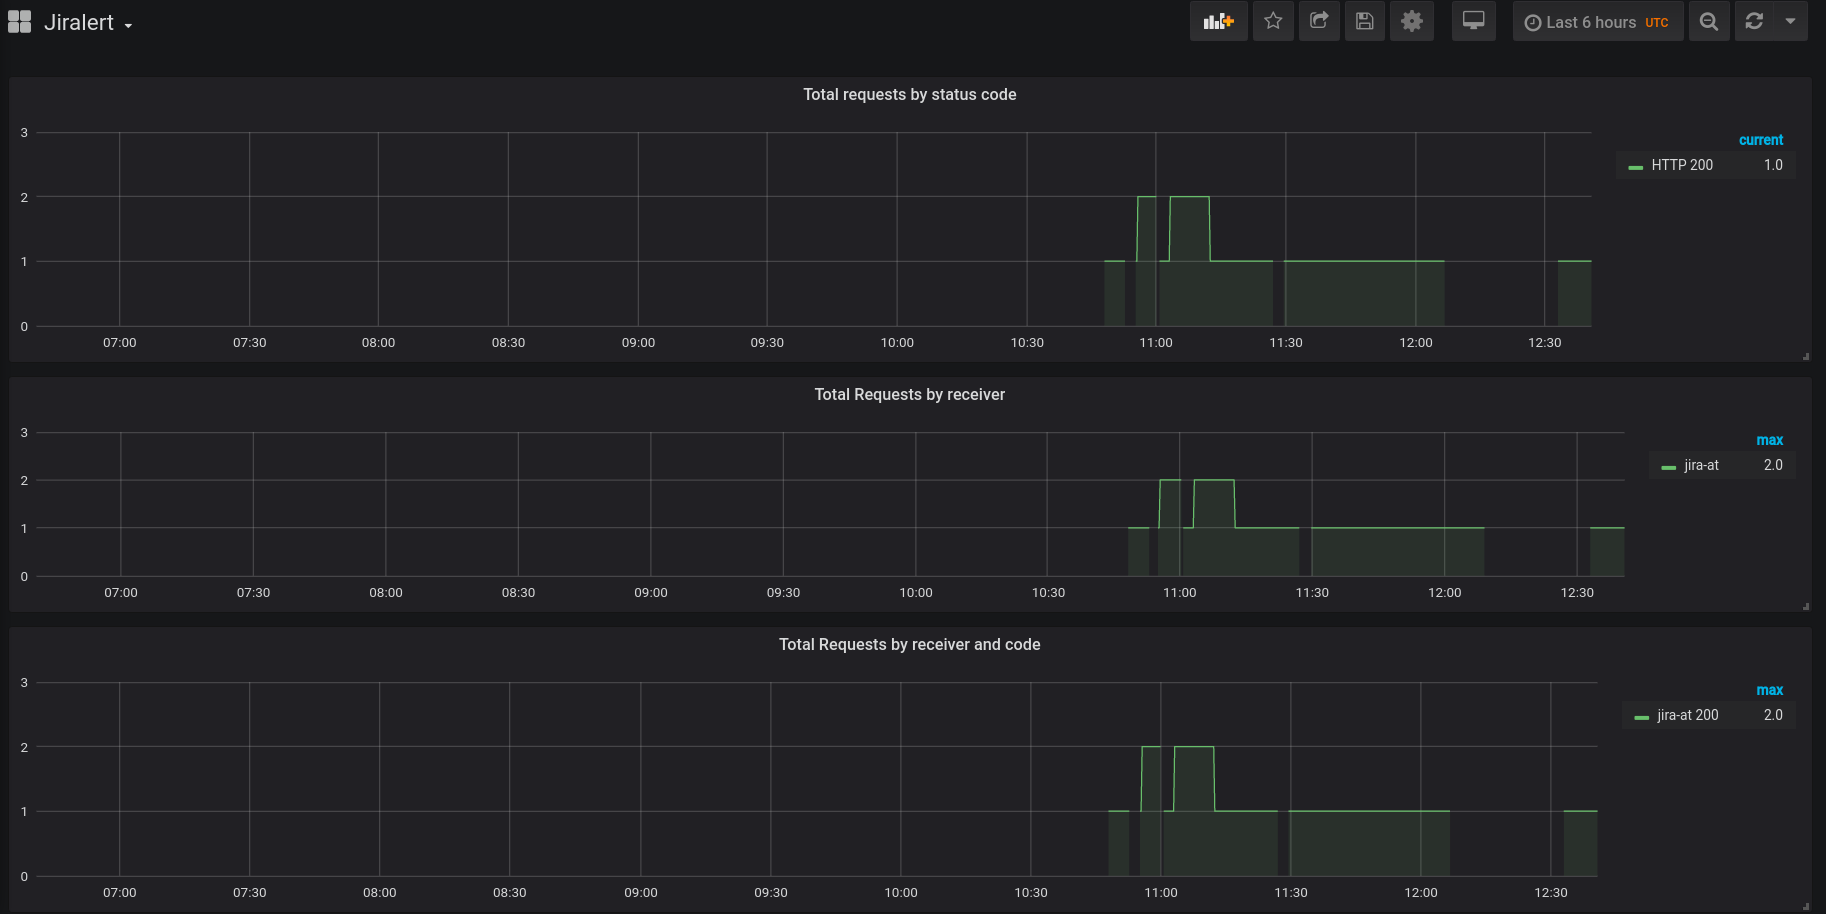
Minimal metrics based on prometheus datasource from kubernetes pods.
Nothing special, really, you need to add your own service and servicemonitor, though.
Total requests grouped by code, receiver. Datasource - Prometheus 2.10, deployed on k8s.
JIRAlert - github
Contact
- contact author if you have any suggestions etc
Data source config
Collector config:
Upload an updated version of an exported dashboard.json file from Grafana
| Revision | Description | Created | |
|---|---|---|---|
| Download |

