GitLab CI pipelines
This dashboard leverages the Prometheus exporter I wrote to fetch information about GitLab CI pipelines statuses. More information here: https://github.com/mvisonneau/gitlab-ci-pipelines-exporter
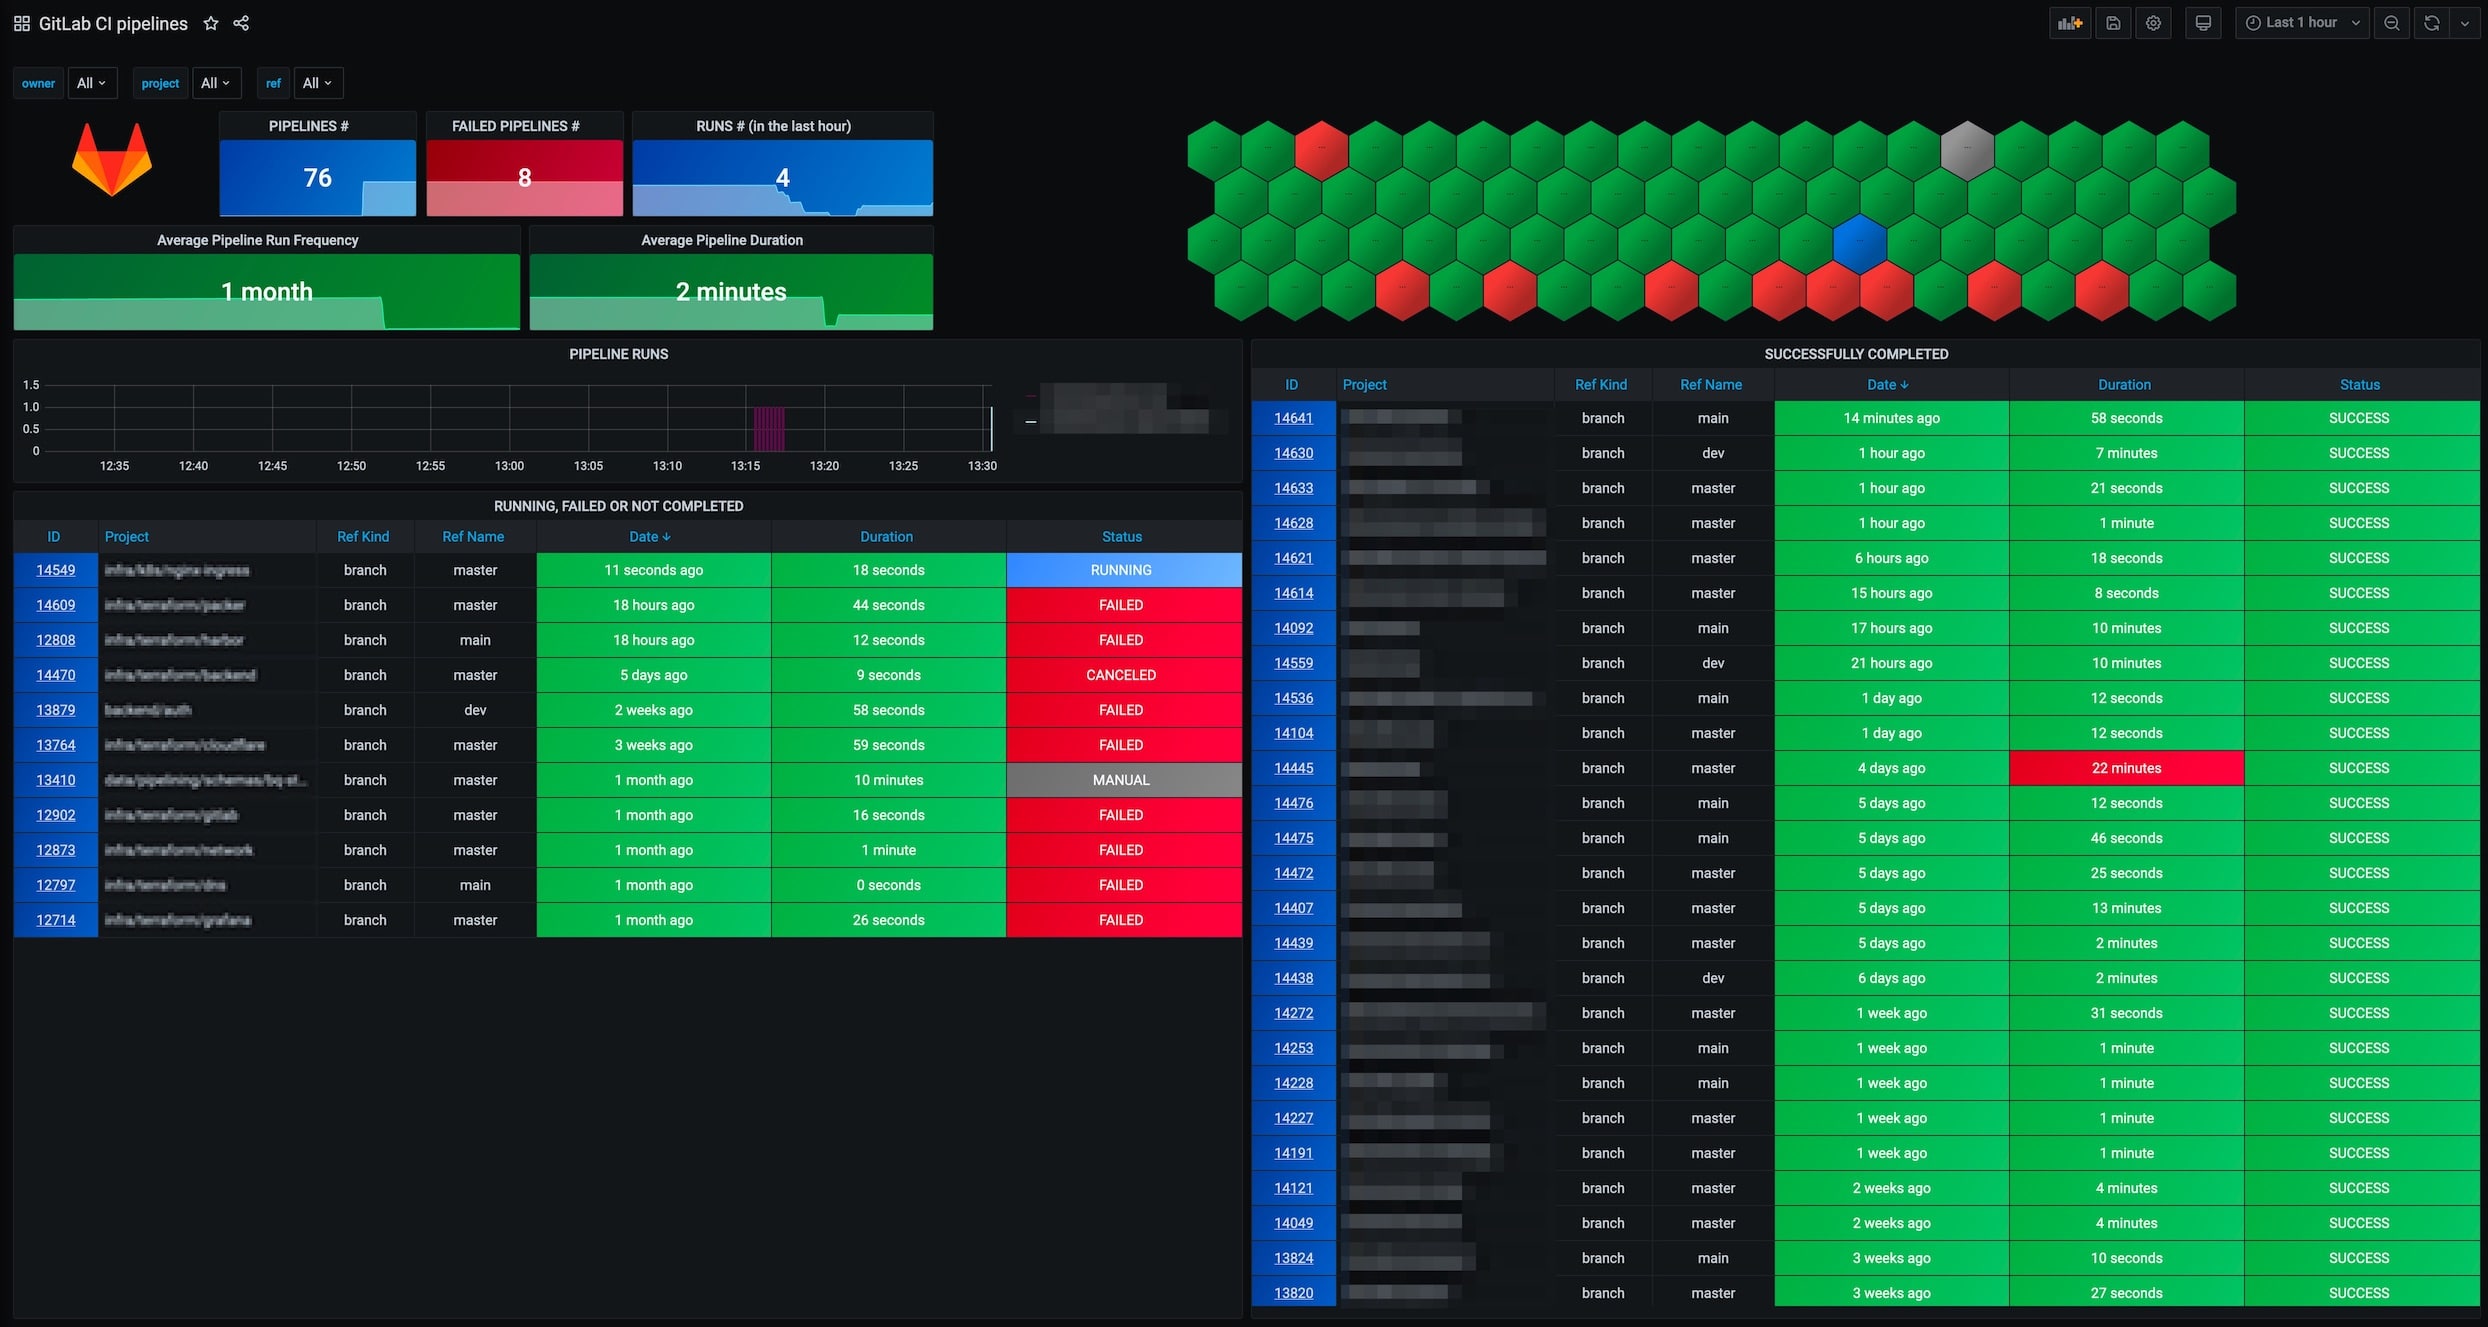
The GitLab CI pipelines dashboard uses the prometheus data source to create a Grafana dashboard with the grafana-polystat-panel, graph, stat, table and text panels.
Data source config
Collector type:
Collector plugins:
Collector config:
Revisions
Upload an updated version of an exported dashboard.json file from Grafana
| Revision | Description | Created | |
|---|---|---|---|
| Download |
GitLab
Monitor GitLab with Grafana. Easily monitor your GitLab Enterprise Edition with Grafana Cloud's out-of-the-box monitoring solution.
Learn more