Zookeeper Cluster Dashboard
Metrics was extracted from jmx-exporter that reads JMX data from JVM based applications and exposes it via HTTP in a simple text format that Prometheus understand and can scrape. This dashboard was built for Zookeeper 3.5 version deployment in Local Cluster. You can select metrics based on Job & instance. This dashboard gives cross cluster zookeeper nodes information. It provides Quorum Size, Number of Followers, Member Type information, Healthcheck, Zookeeper metrics and JVM metics.
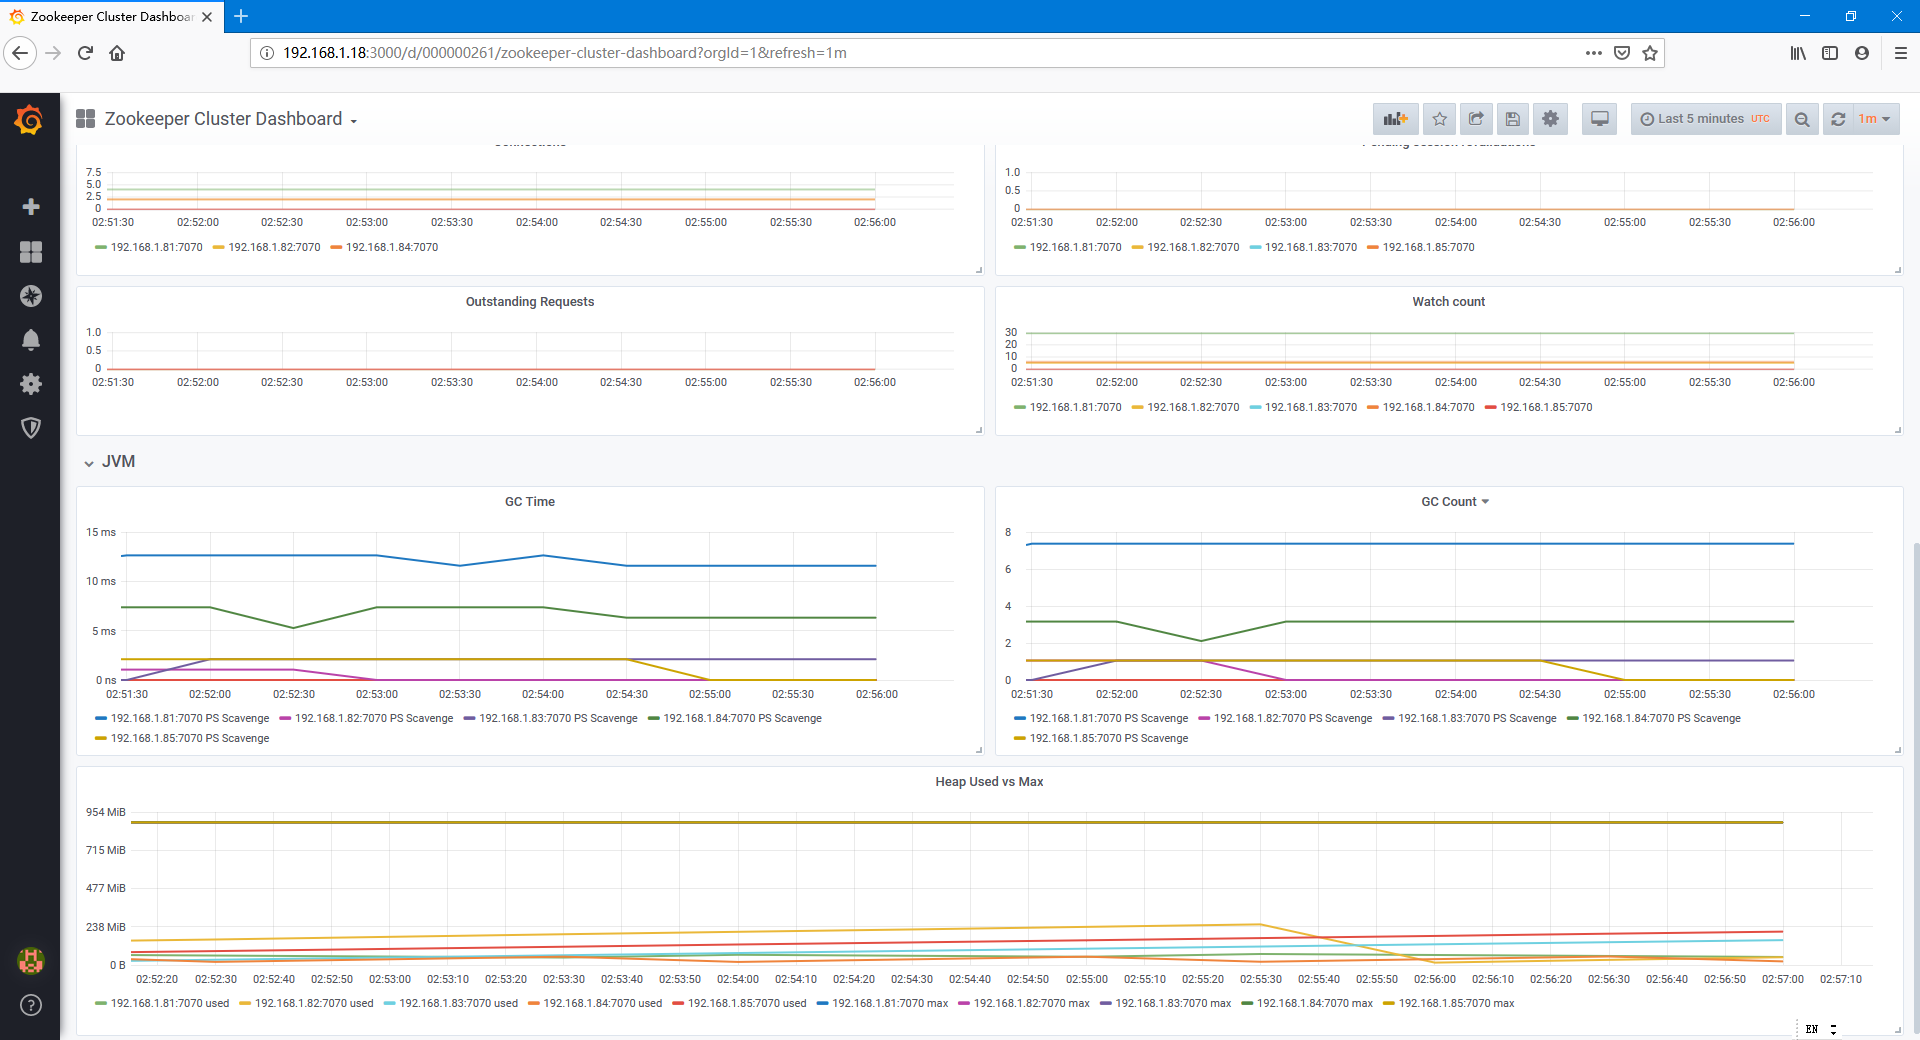
The Zookeeper Cluster Dashboard dashboard uses the prometheus data source to create a Grafana dashboard with the graph panel.
Data source config
Collector type:
Collector plugins:
Collector config:
Revisions
Upload an updated version of an exported dashboard.json file from Grafana
| Revision | Description | Created | |
|---|---|---|---|
| Download |