
etcd
Basic etcd metrics, queried from InfluxDB, scraped from etcd's built-in Prometheus metrics endpoint
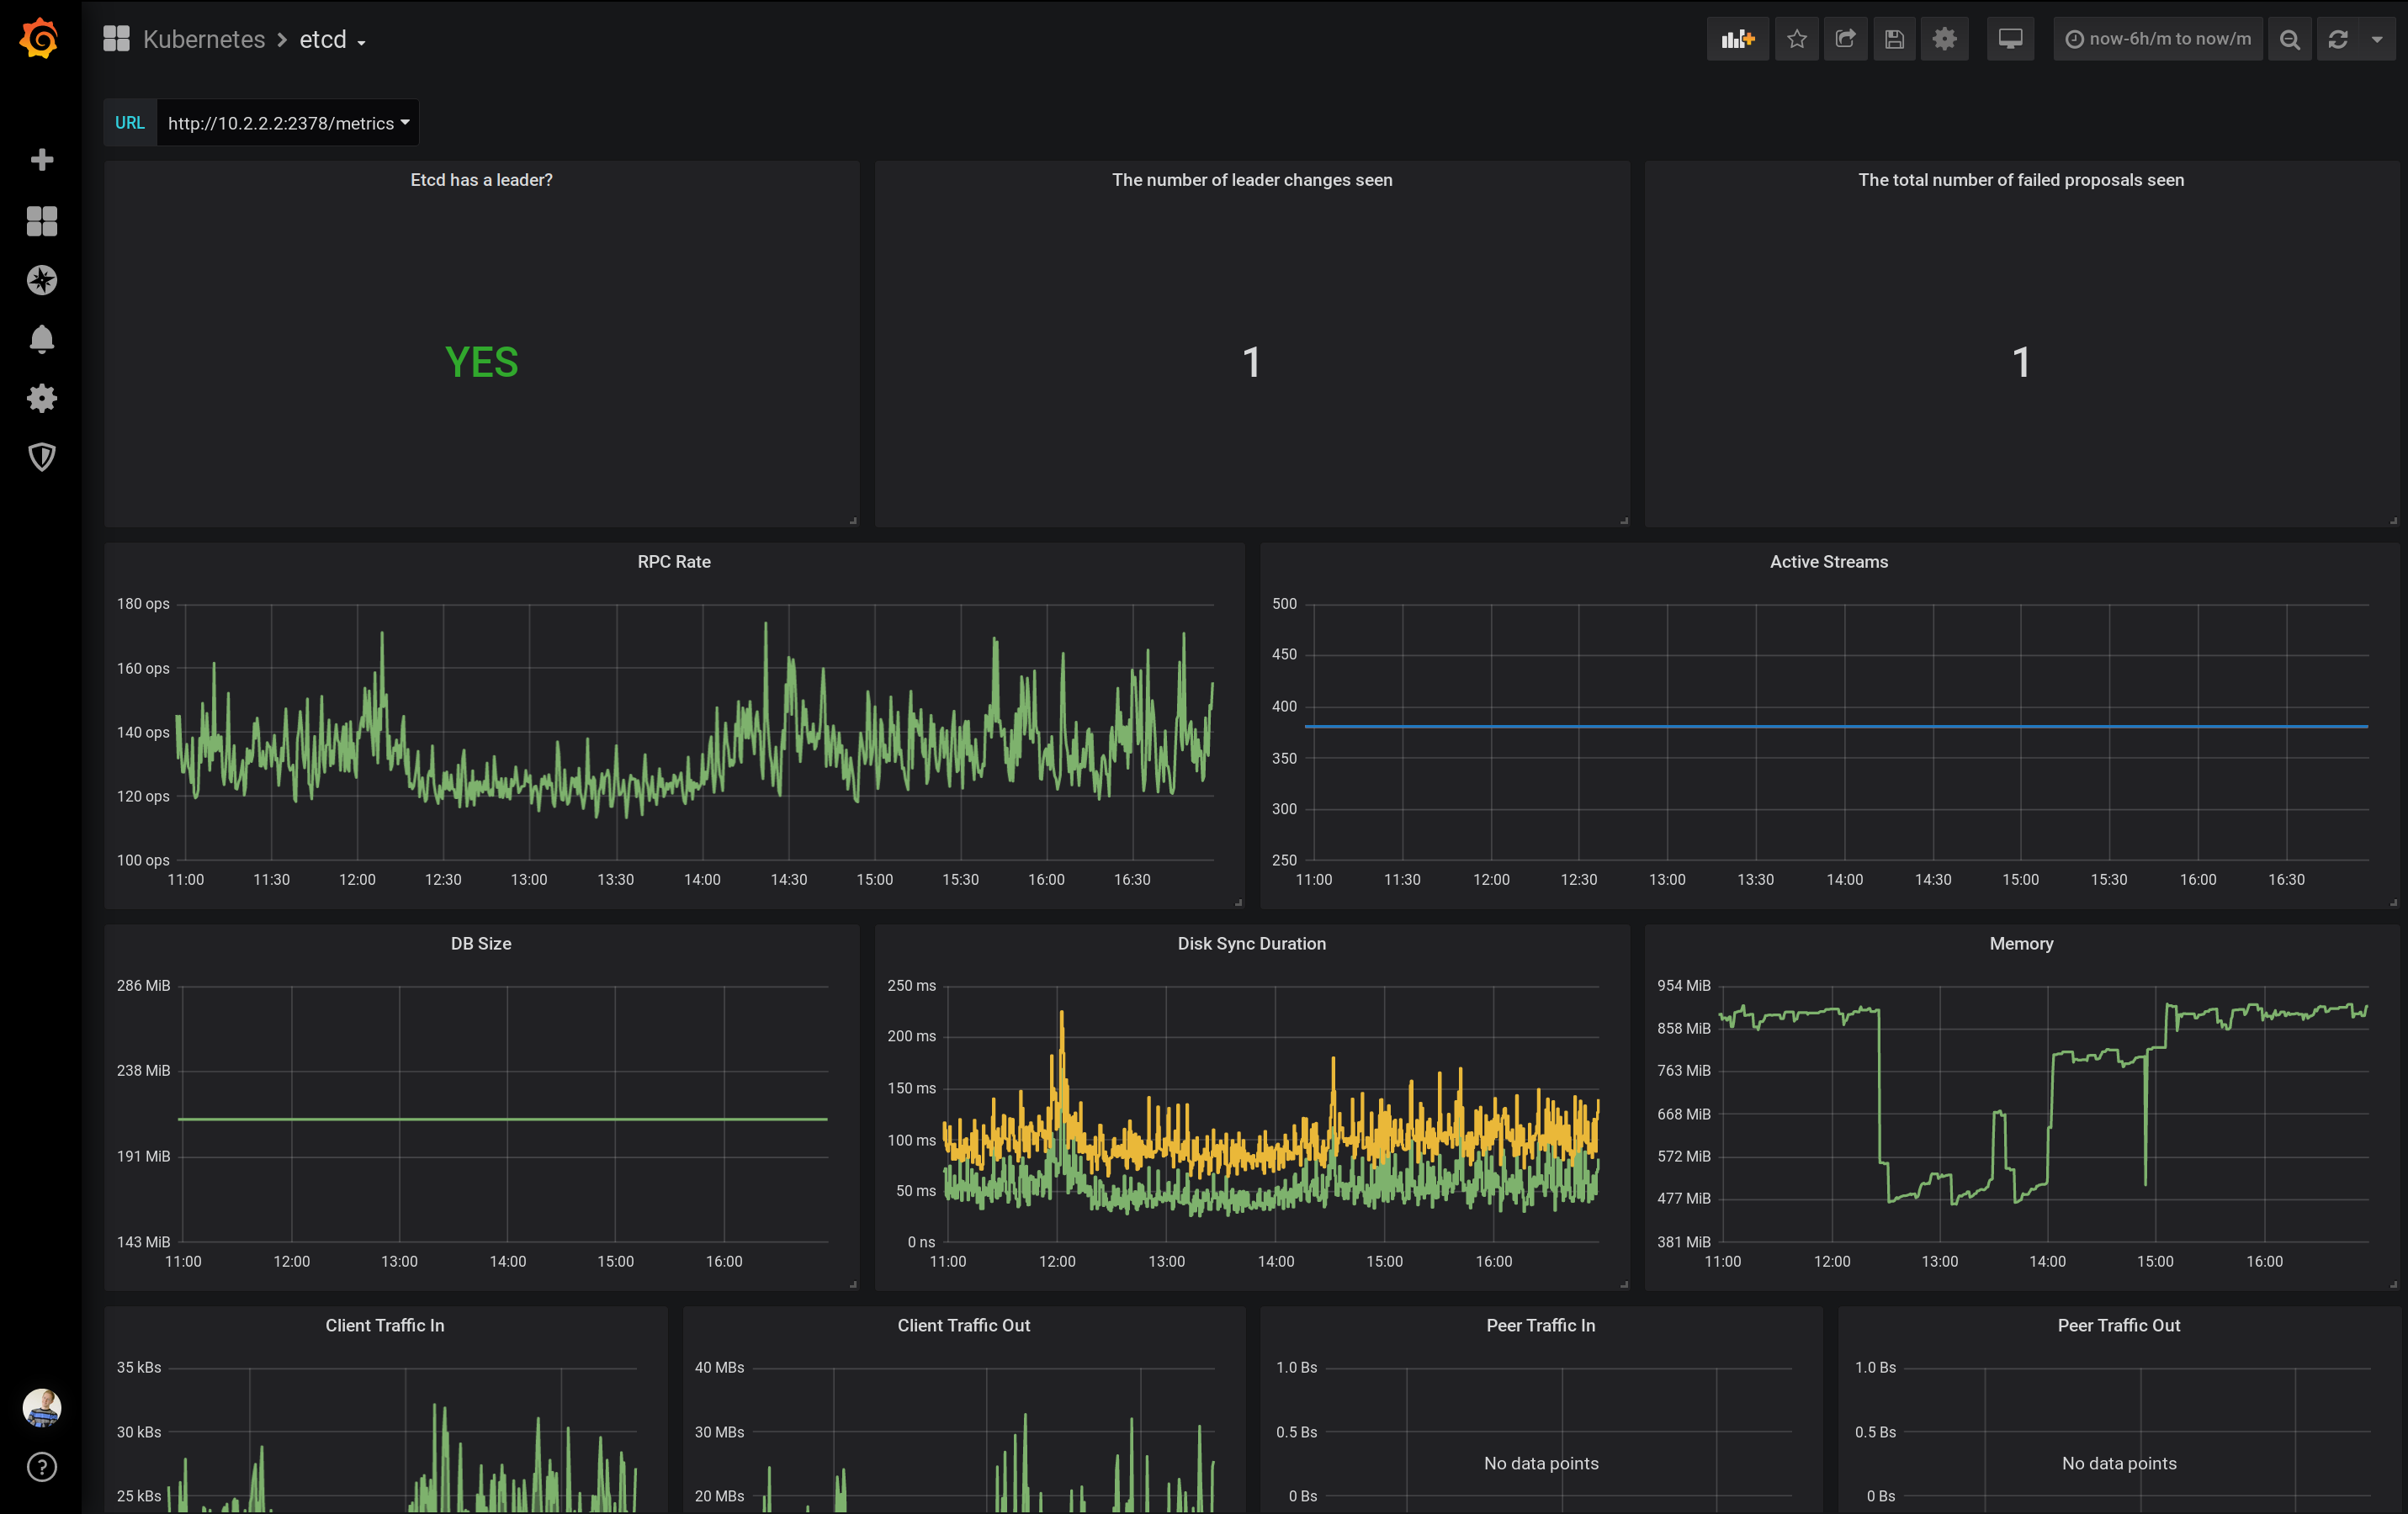
Clone of https://grafana.com/grafana/dashboards/3070
Remade to support InfluxDB
Data source config
Collector type:
Collector plugins:
Collector config:
Revisions
Upload an updated version of an exported dashboard.json file from Grafana
| Revision | Description | Created | |
|---|---|---|---|
| Download |
etcd
Easily monitor etcd, a distributed key-value store, ewith Grafana Cloud's out-of-the-box monitoring solution.
Learn more