k6 Load Testing Results
A dashboard for visualizing results from the k6.io load testing tool, using the InfluxDB exporter. Based on https://grafana.com/dashboards/4411
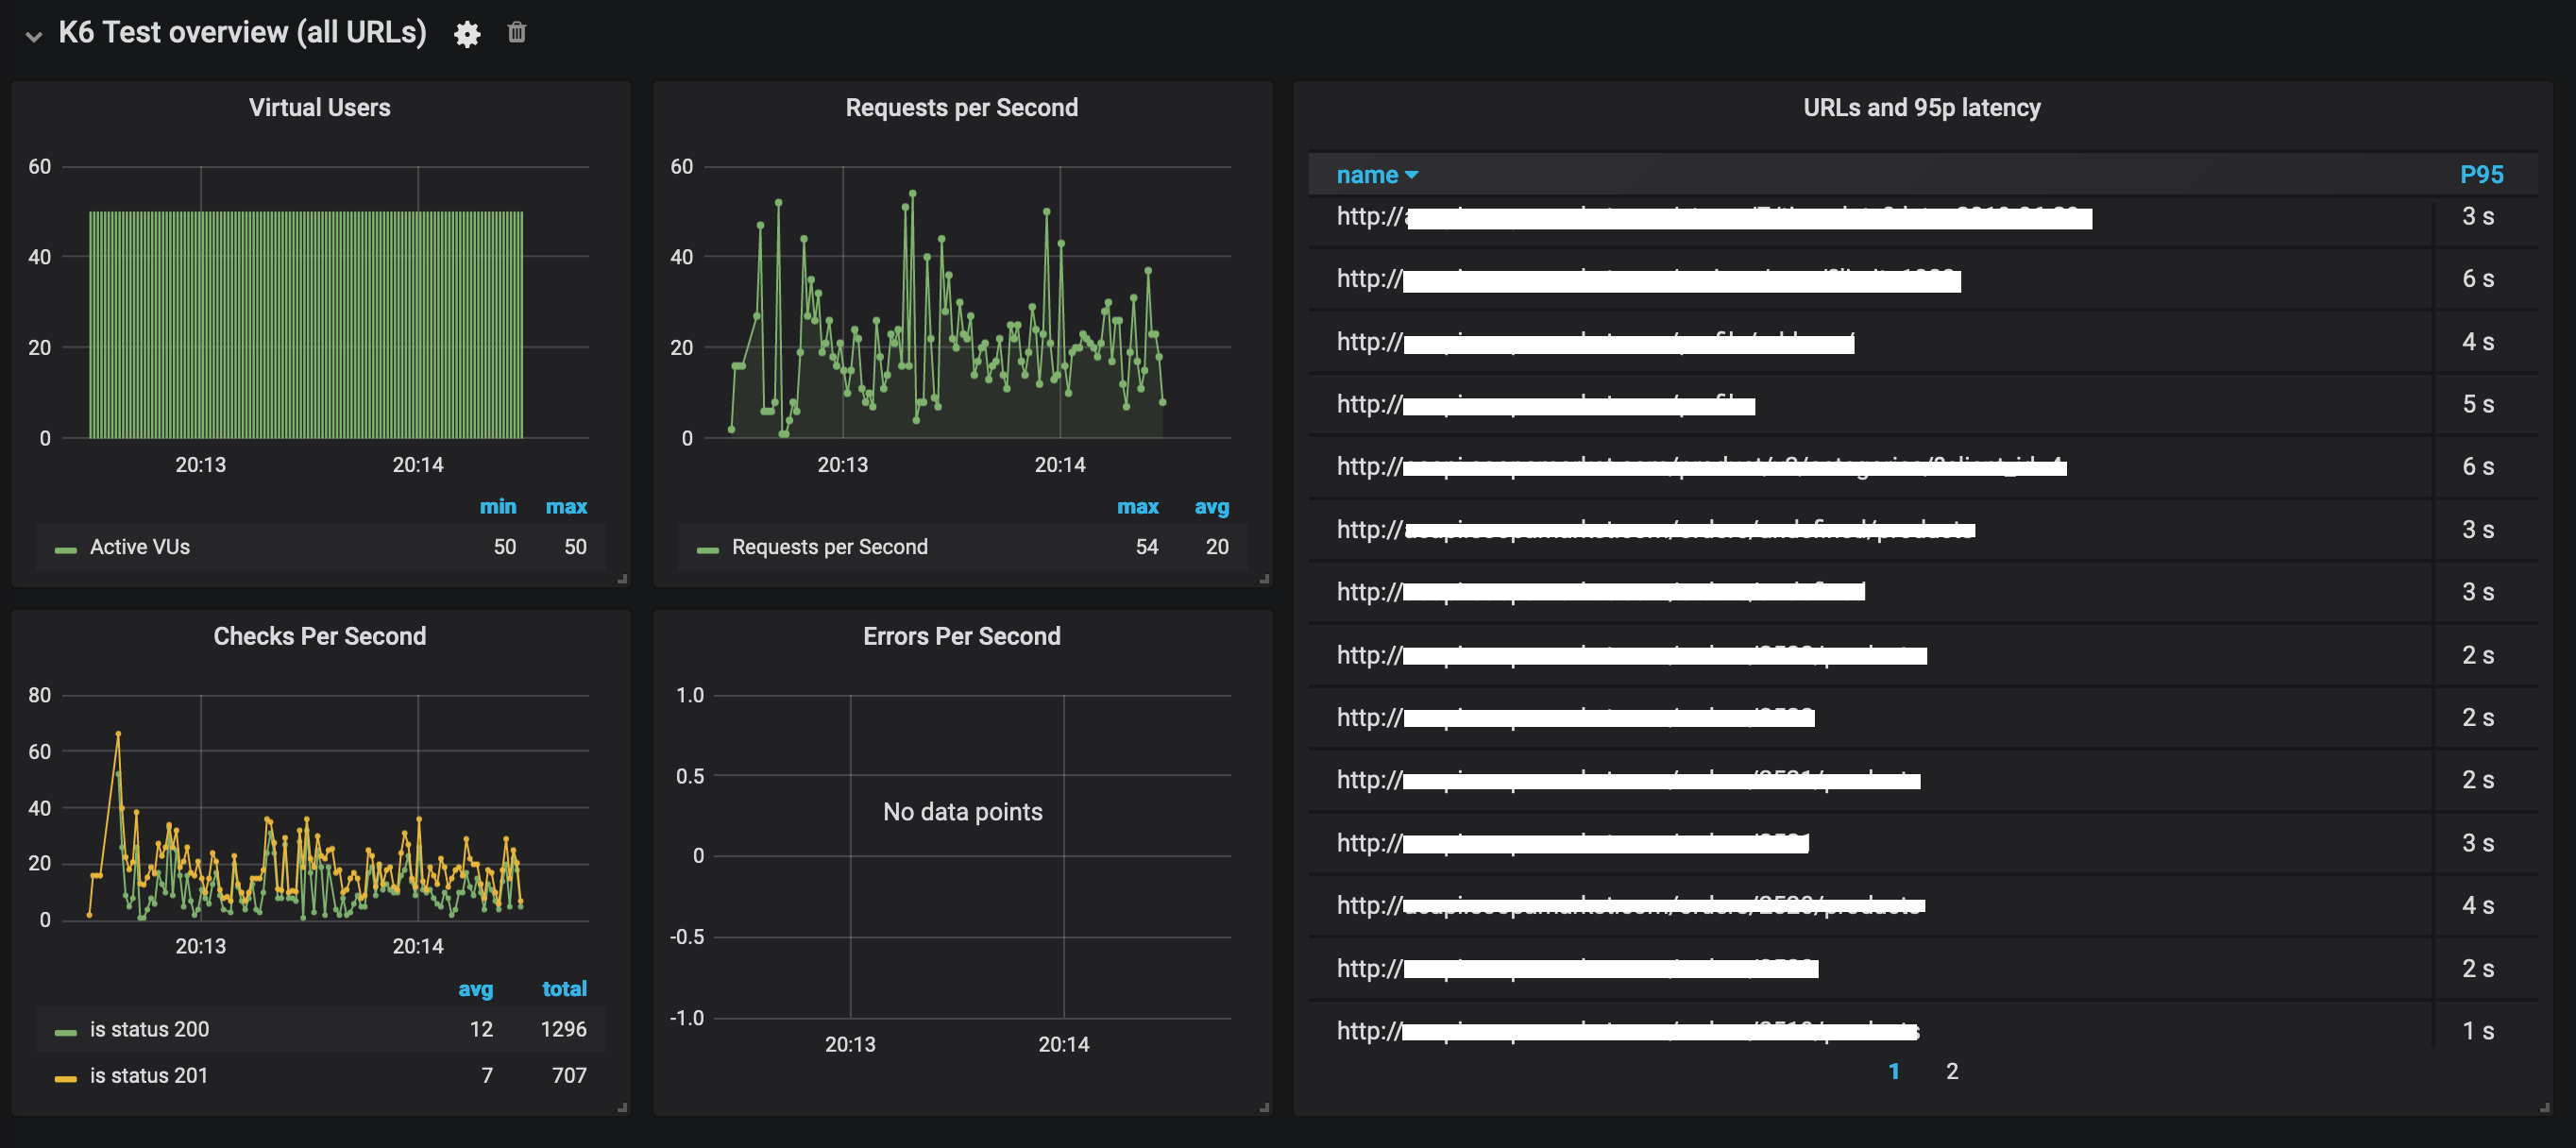
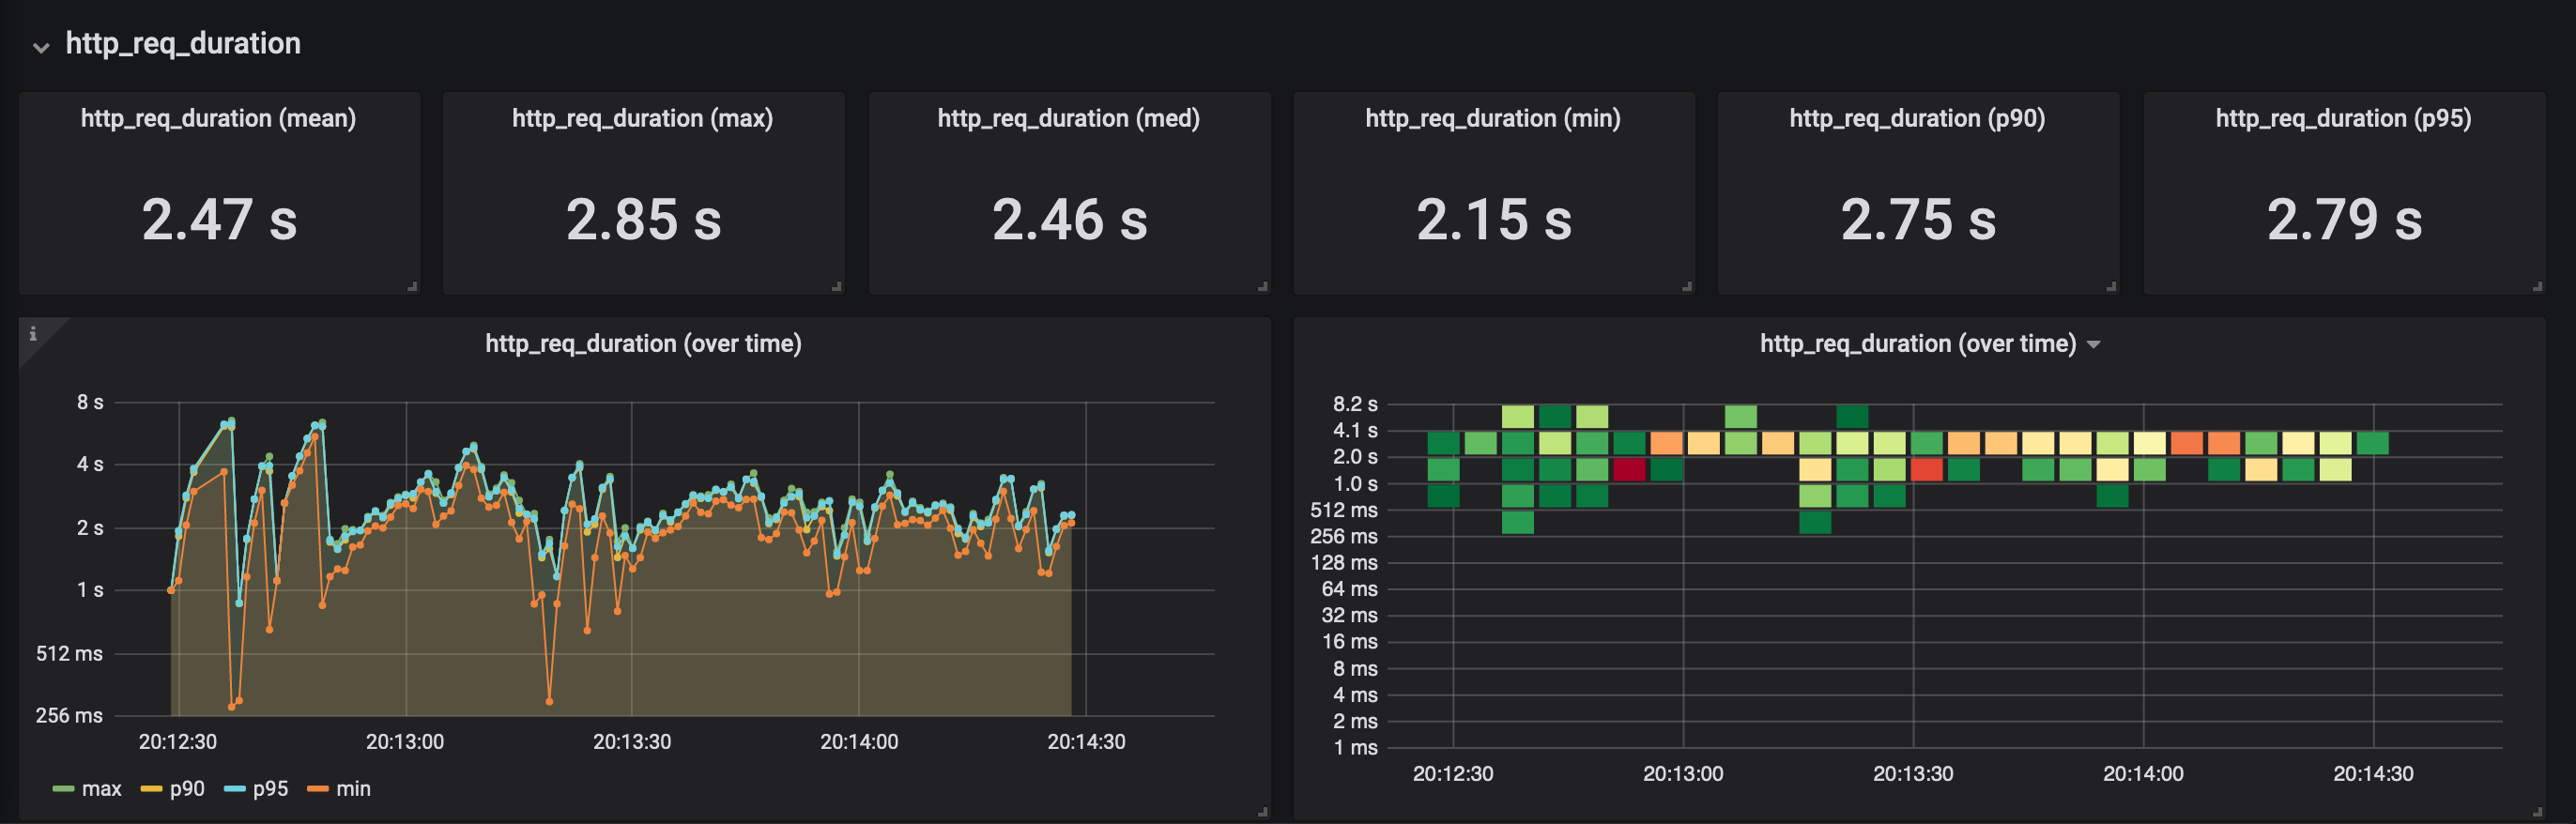
The k6 Load Testing Results dashboard uses the influxdb data source to create a Grafana dashboard with the graph, heatmap, singlestat, table and text panels.
Data source config
Collector type:
Collector plugins:
Collector config:
Revisions
Upload an updated version of an exported dashboard.json file from Grafana
| Revision | Description | Created | |
|---|---|---|---|
| Download |