S.M.A.R.T disk monitoring for Prometheus Errorboard (DEPRECATED)
Smartmon Texfile node_exporter Dashboard Extends the following dashboard: https://grafana.com/dashboards/10530
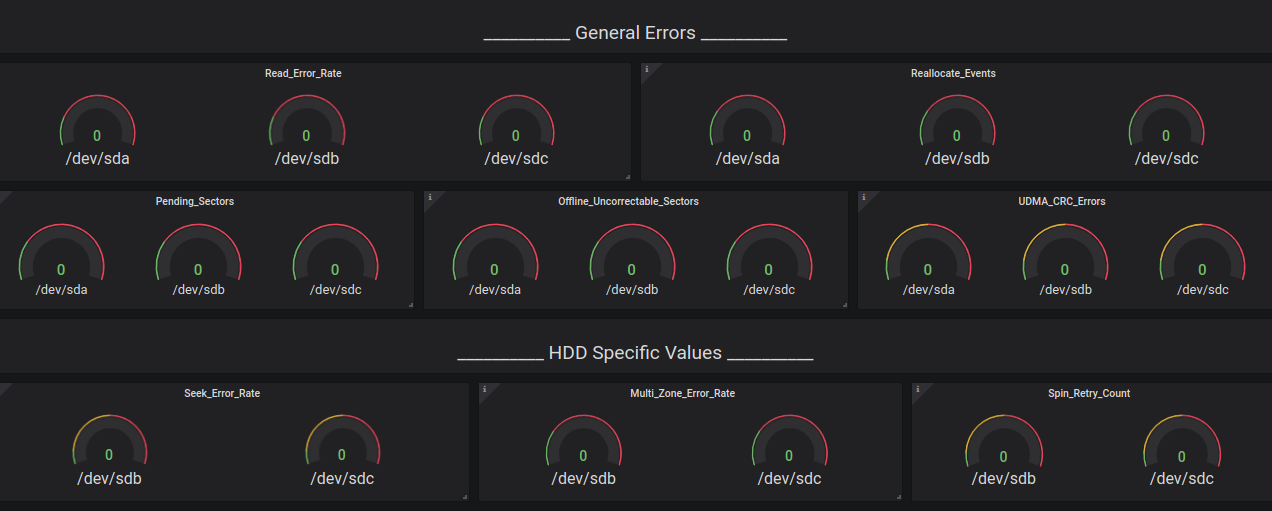
This dashboard is not maintained anymore as most of its content is now merged into: https://grafana.com/grafana/dashboards/10530-s-m-a-r-t-disk-monitoring-for-prometheus-dashboard/
Data source config
Collector type:
Collector plugins:
Collector config:
Revisions
Upload an updated version of an exported dashboard.json file from Grafana
| Revision | Description | Created | |
|---|---|---|---|
| Download |
Metrics Endpoint (Prometheus)
Easily monitor any Prometheus-compatible and publicly accessible metrics URL with Grafana Cloud's out-of-the-box monitoring solution.
Learn more