S.M.A.R.T disk monitoring for Prometheus Dashboard
Smartmon Texfile node_exporter Dashboard
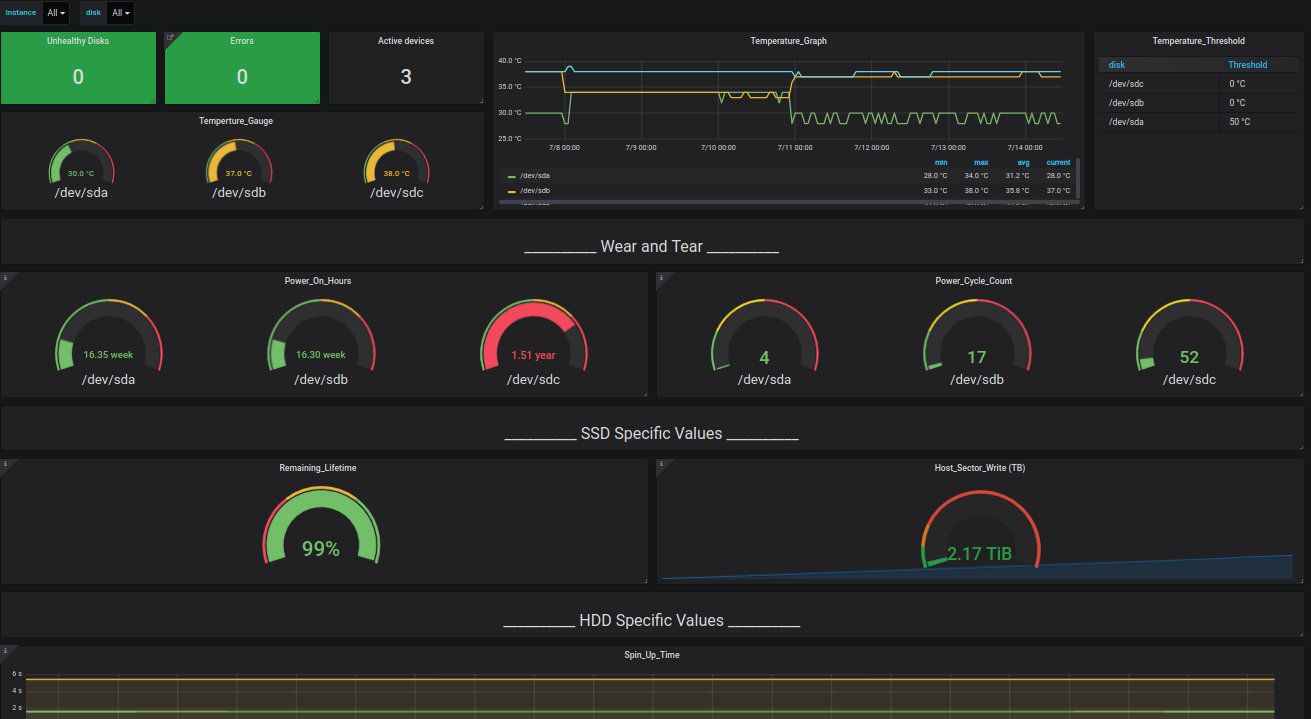
Summary of S.M.A.R.T. values to see if temperature is in the desired range and get indicators about wear and tear. Also gives an overview of specific error types.
This dashboard is designed for smart exporter "smartmon":
https://github.com/micha37-martins/S.M.A.R.T-disk-monitoring-for-Prometheus
Data source config
Collector type:
Collector plugins:
Collector config:
Revisions
Upload an updated version of an exported dashboard.json file from Grafana
| Revision | Description | Created | |
|---|---|---|---|
| Download |
Metrics Endpoint (Prometheus)
Easily monitor any Prometheus-compatible and publicly accessible metrics URL with Grafana Cloud's out-of-the-box monitoring solution.
Learn more