ZooKeeper by Prometheus
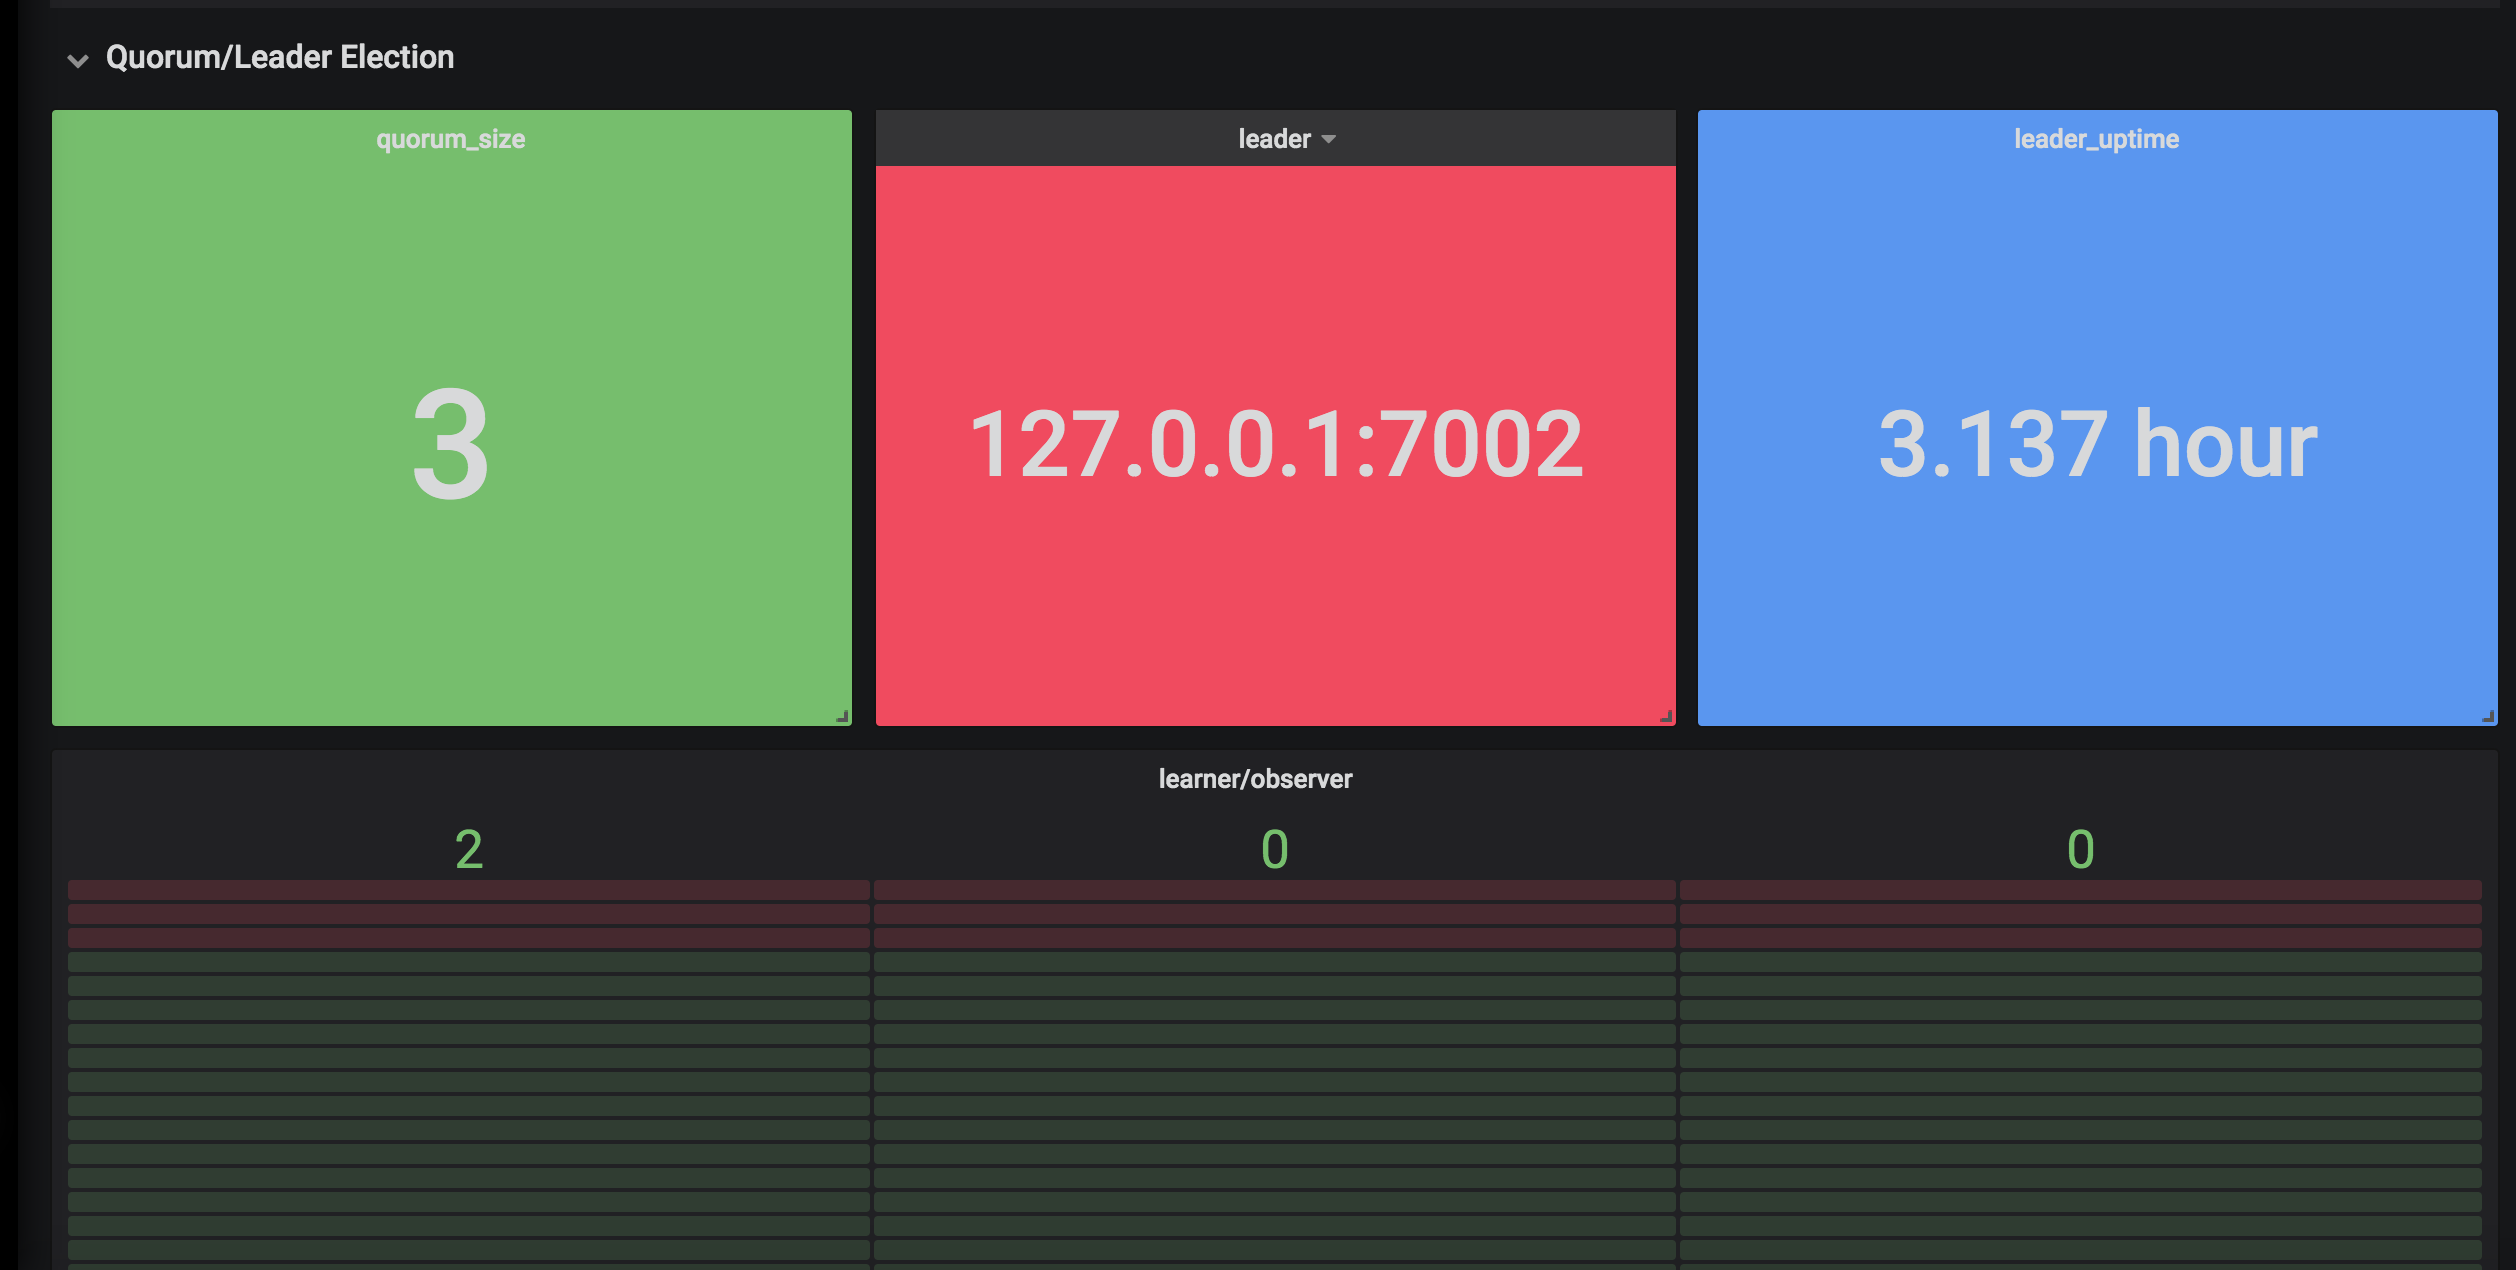
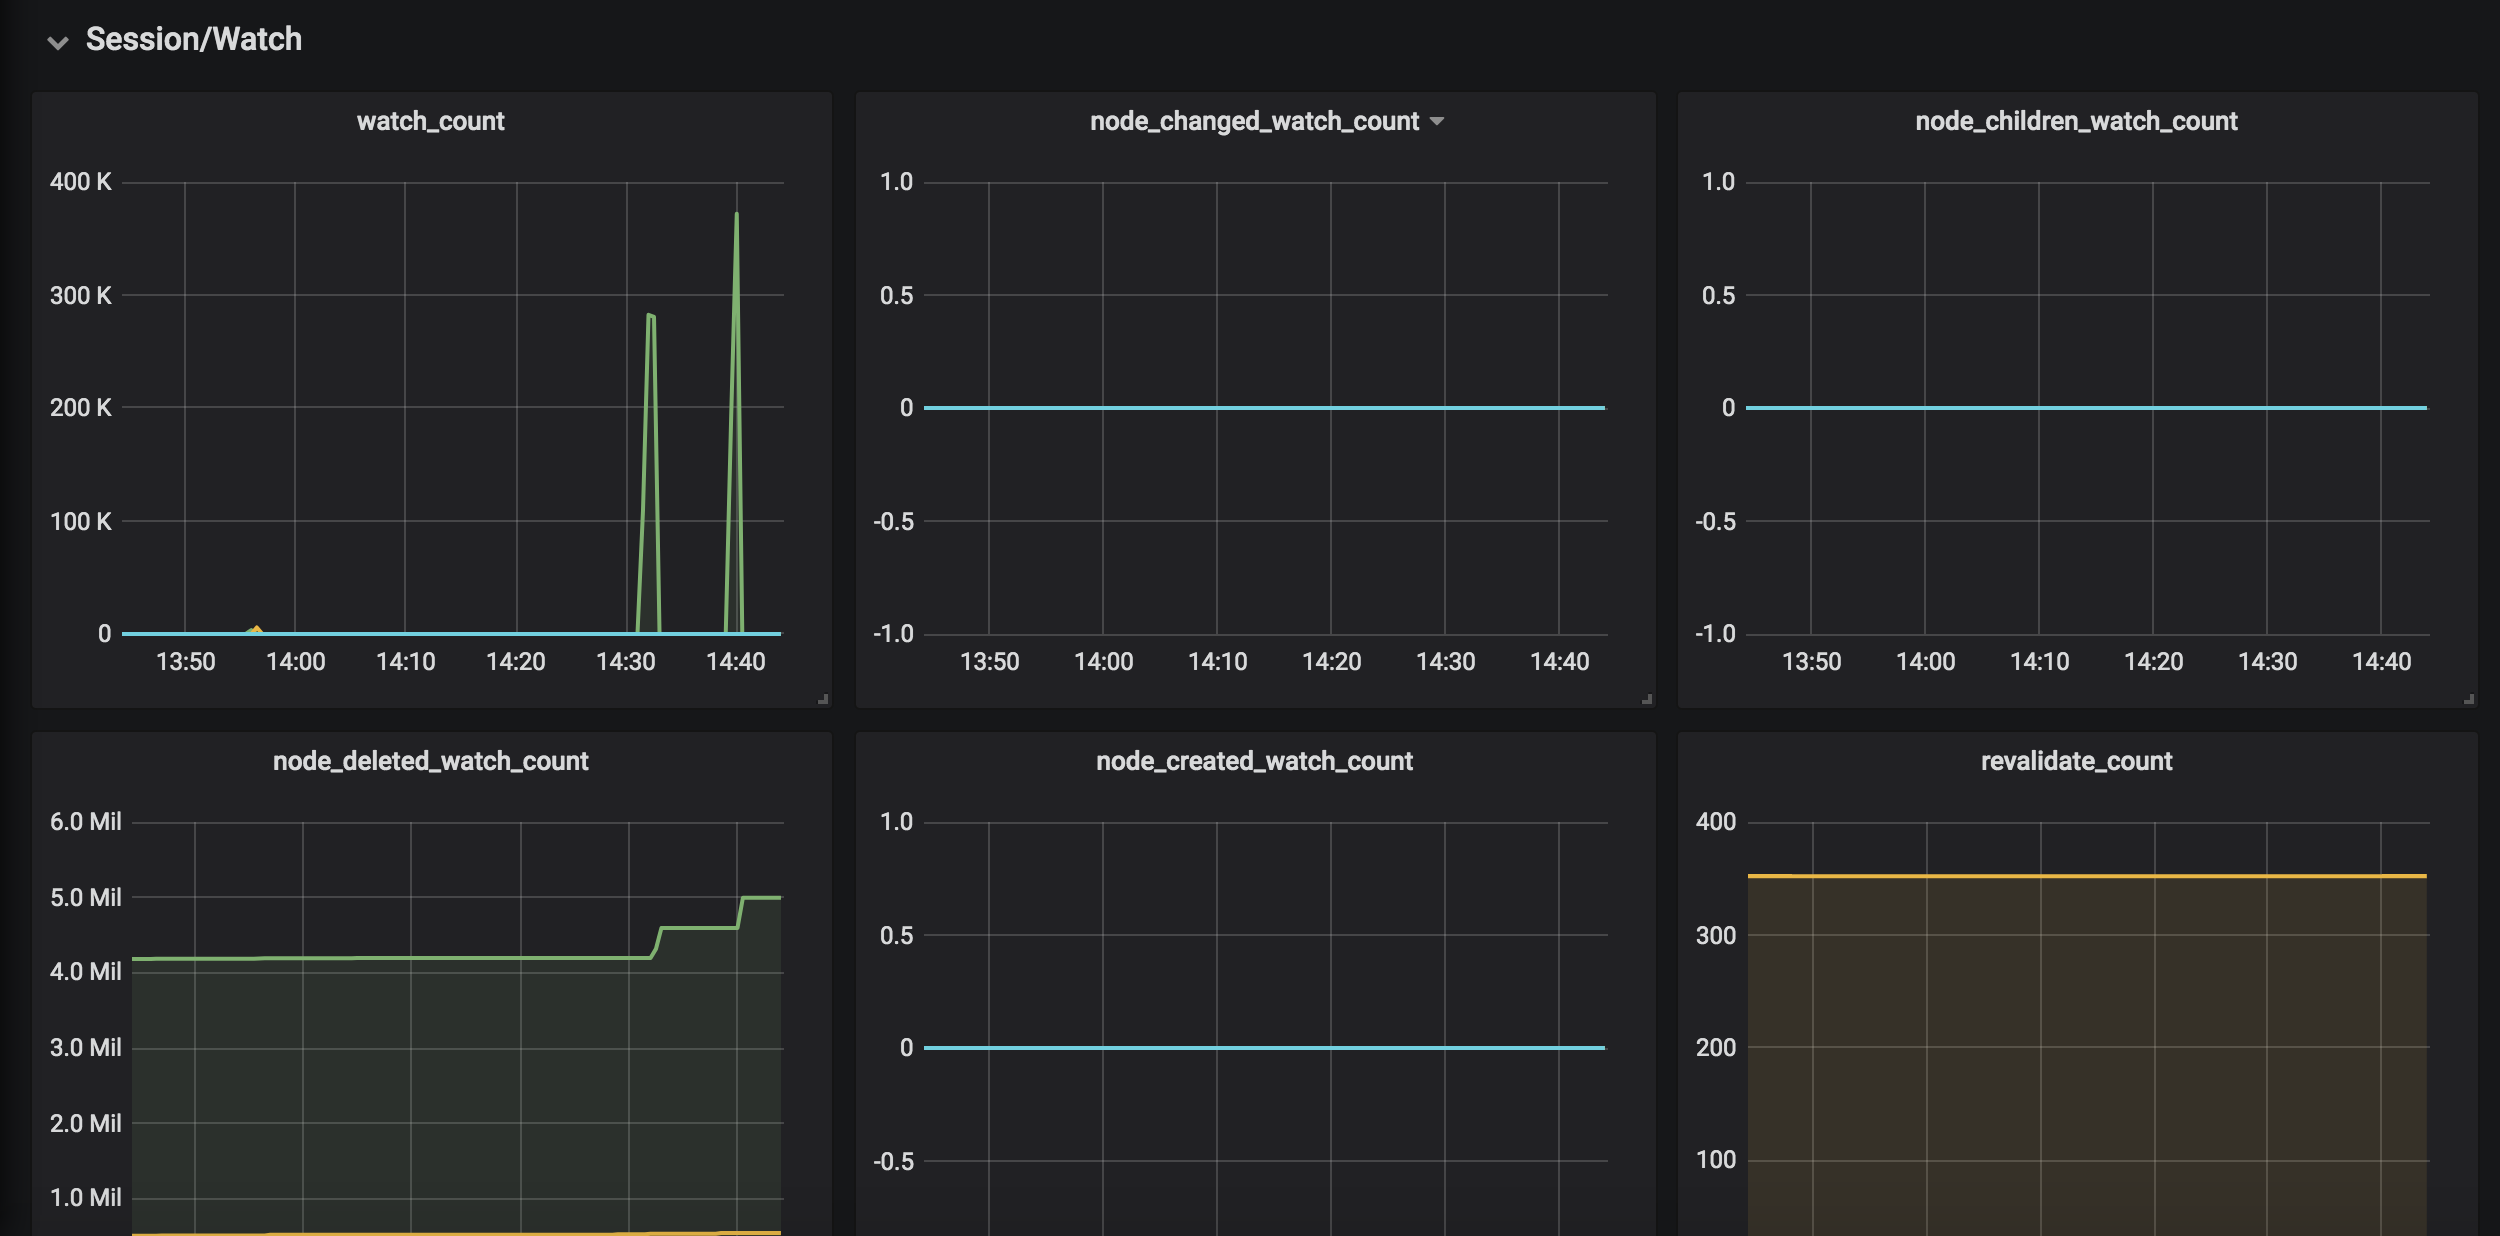
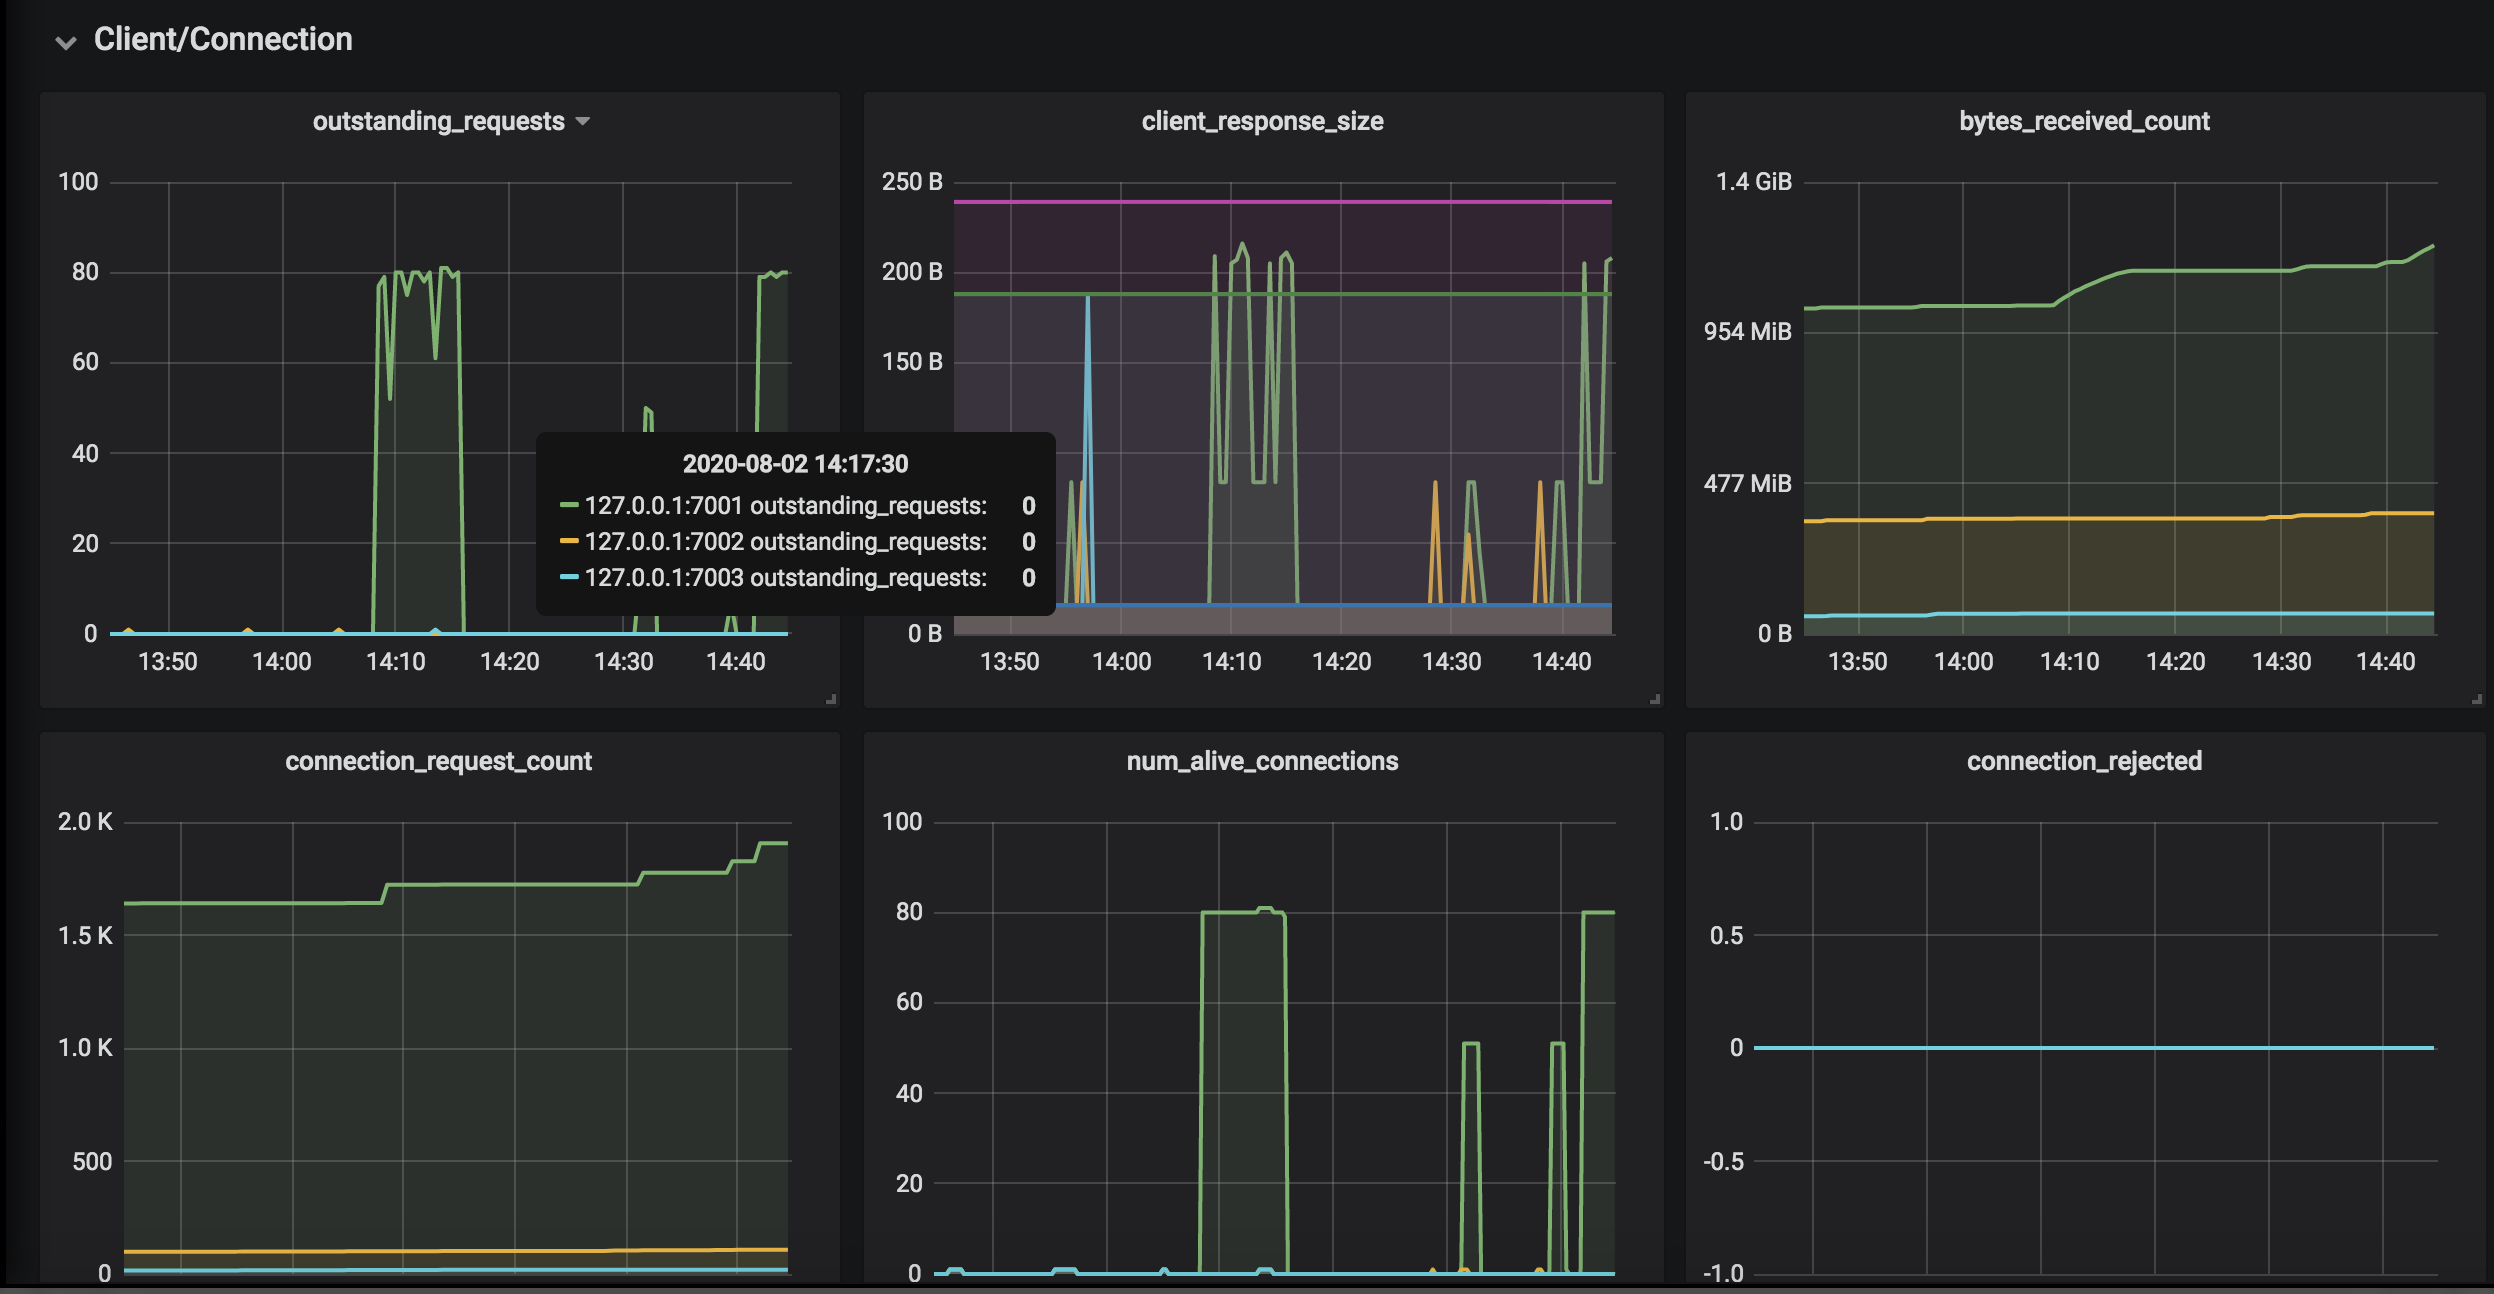
ZooKeeper Dashboard for Prometheus metrics scraper
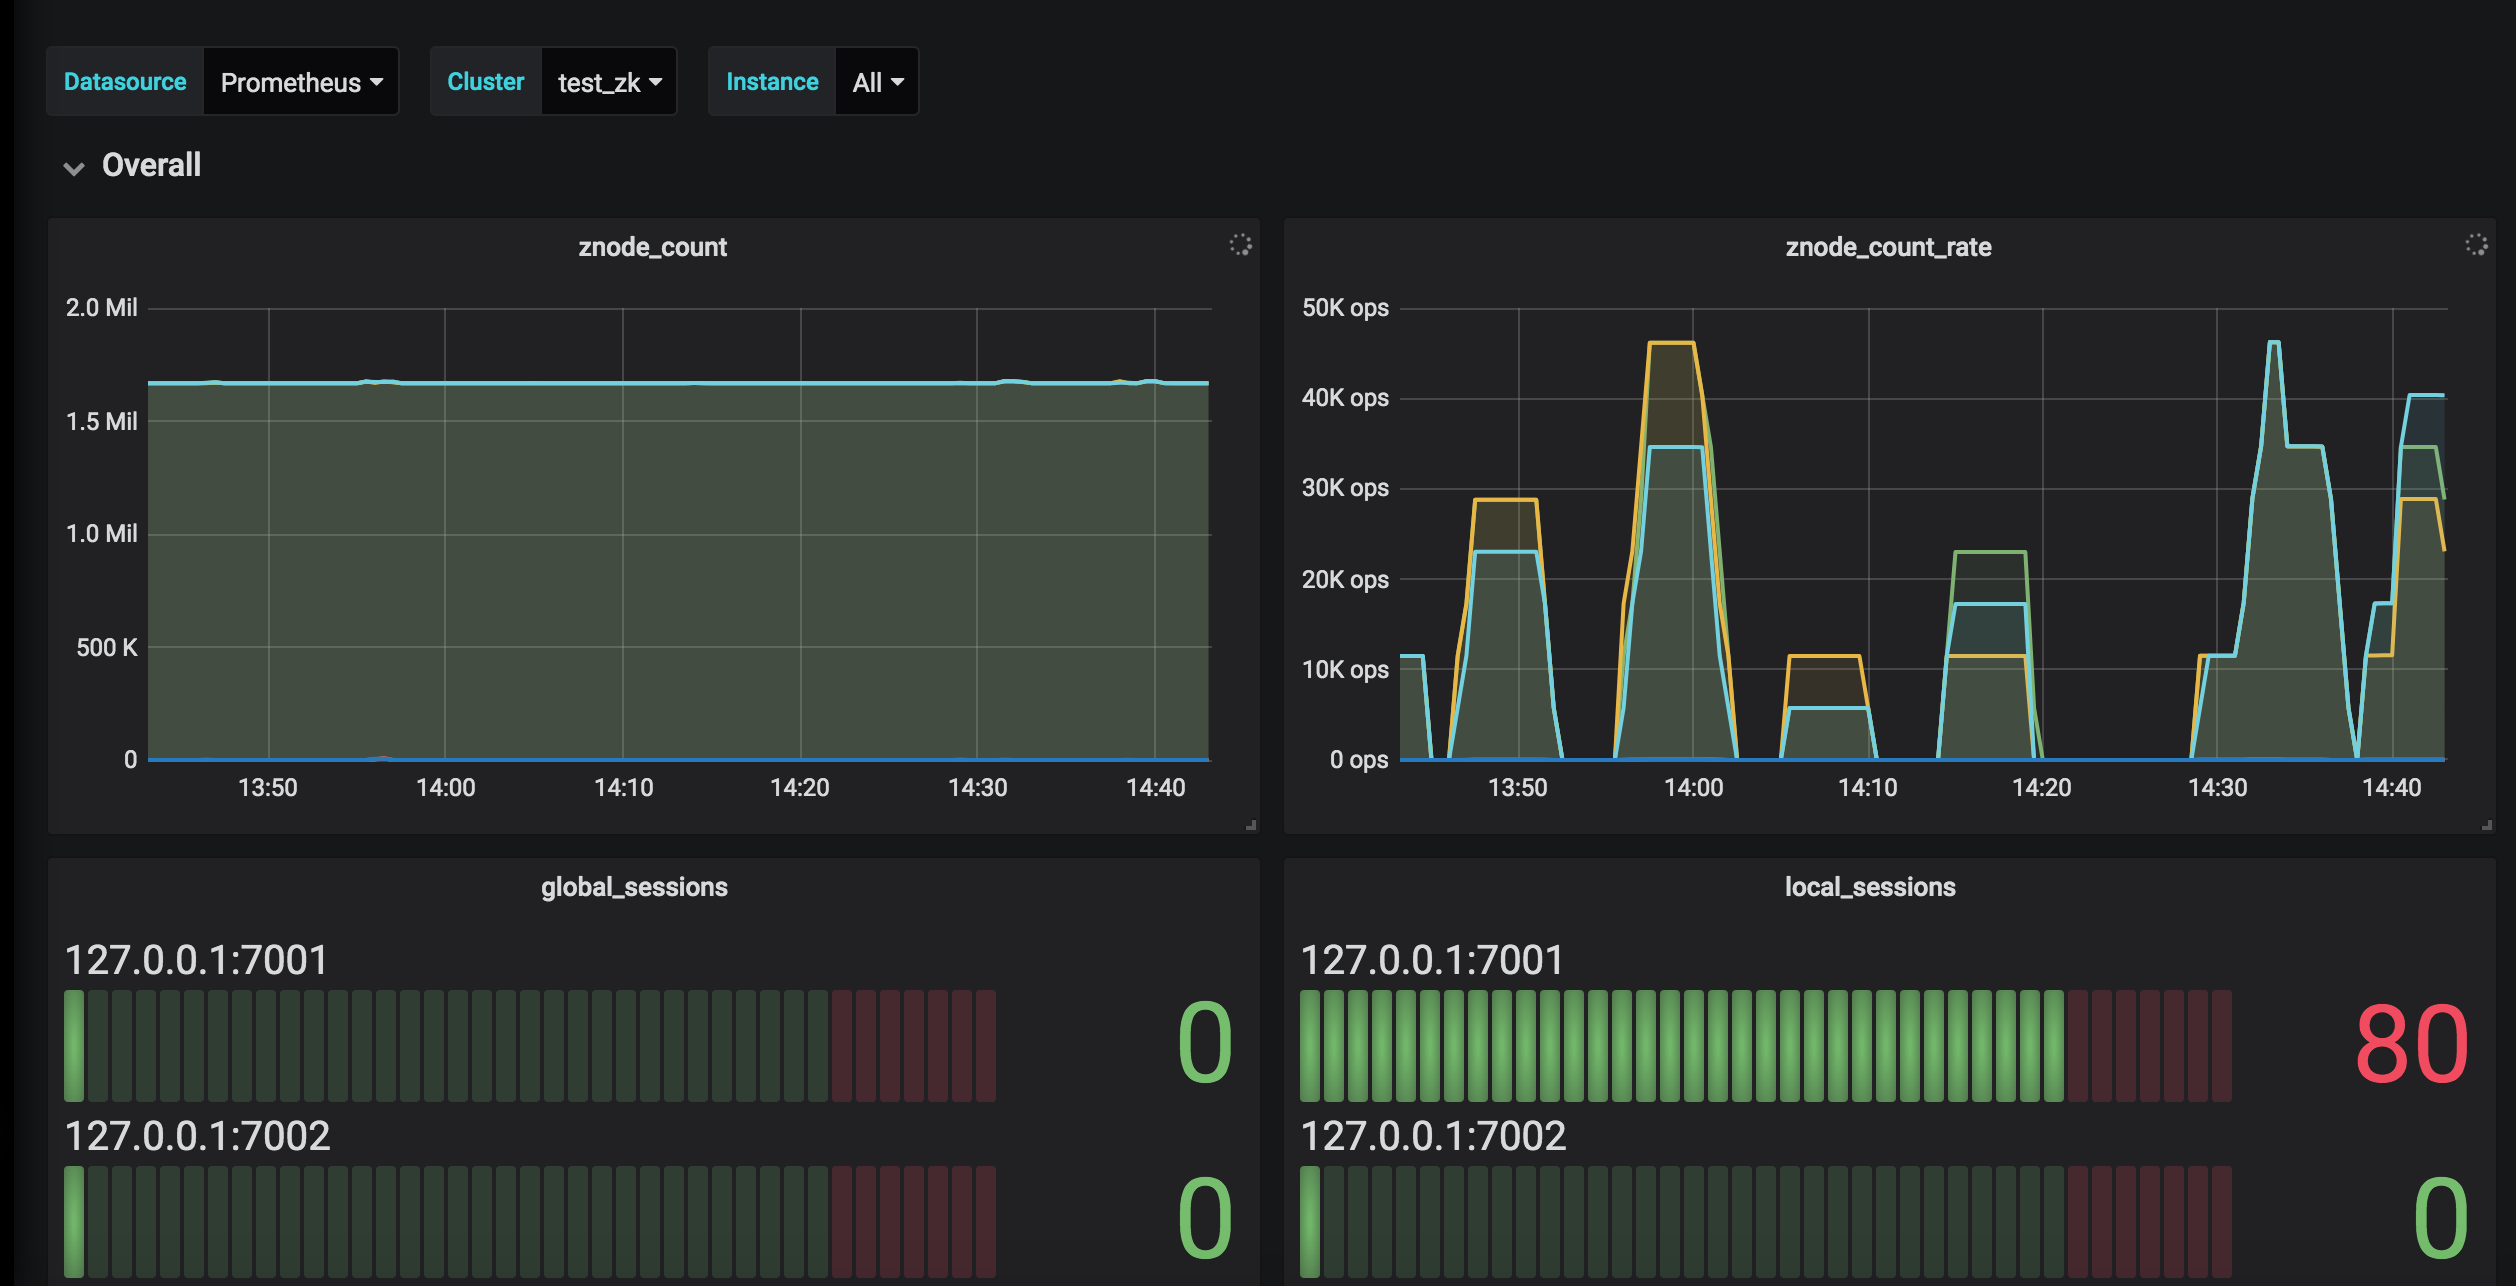
- Tested with: the ZooKeeper new metric system since 3.6.0
- Please contribute, comment, feedback, suggestions here or write an email to maoling199210191@sina.com.
- If you have any issue, you can also report it to https://issues.apache.org/jira/projects/ZOOKEEPER/issues, label it as metric system
- Users can ask for this Grafana dashboard account if having any good improvements by writing an email to dev@zookeeper.apache.org.
- Installation guide can be found: https://github.com/apache/zookeeper/blob/master/zookeeper-docs/src/main/resources/markdown/zookeeperMonitor.md
- For Alerting with Prometheus, Look at: https://github.com/apache/zookeeper/blob/master/zookeeper-docs/src/main/resources/markdown/zookeeperMonitor.md#Alerting
Change Log
[v5]
- TODO: Adapt to kubernetes(k8s) and container environment
[v4]
Feature:
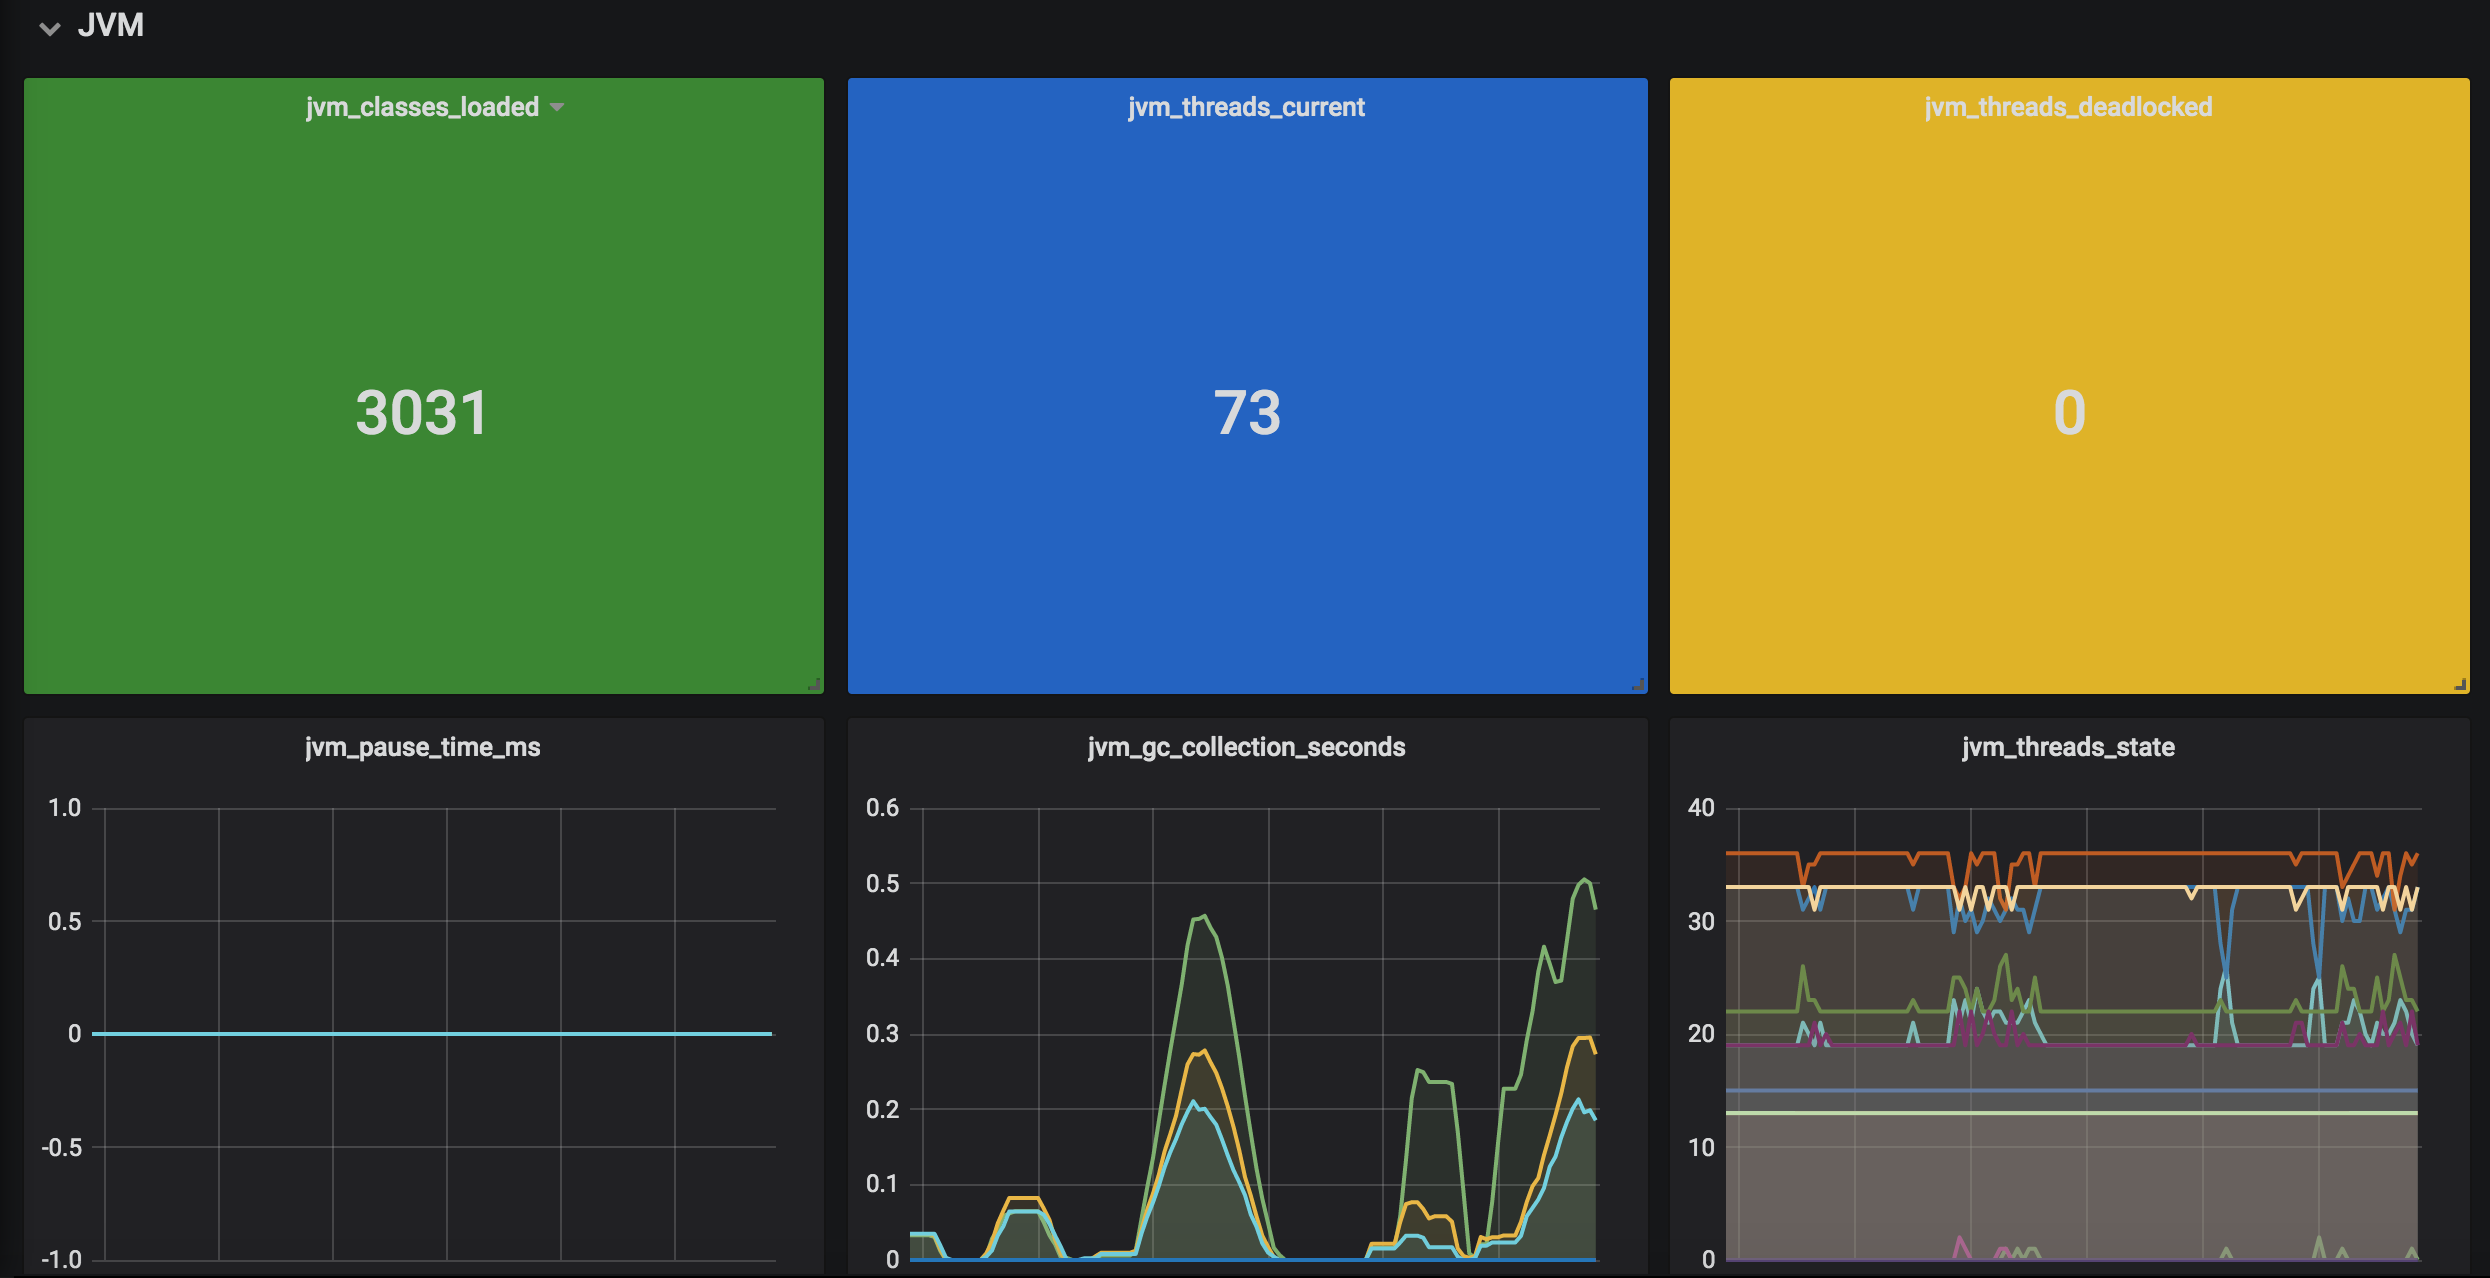
- Add the JVM related metrics
- Support to choose by datasource, job and instance
Fix:
- Remove duplicated metrics: e.g., write_batch_time_in_commit_processor
Improvement:
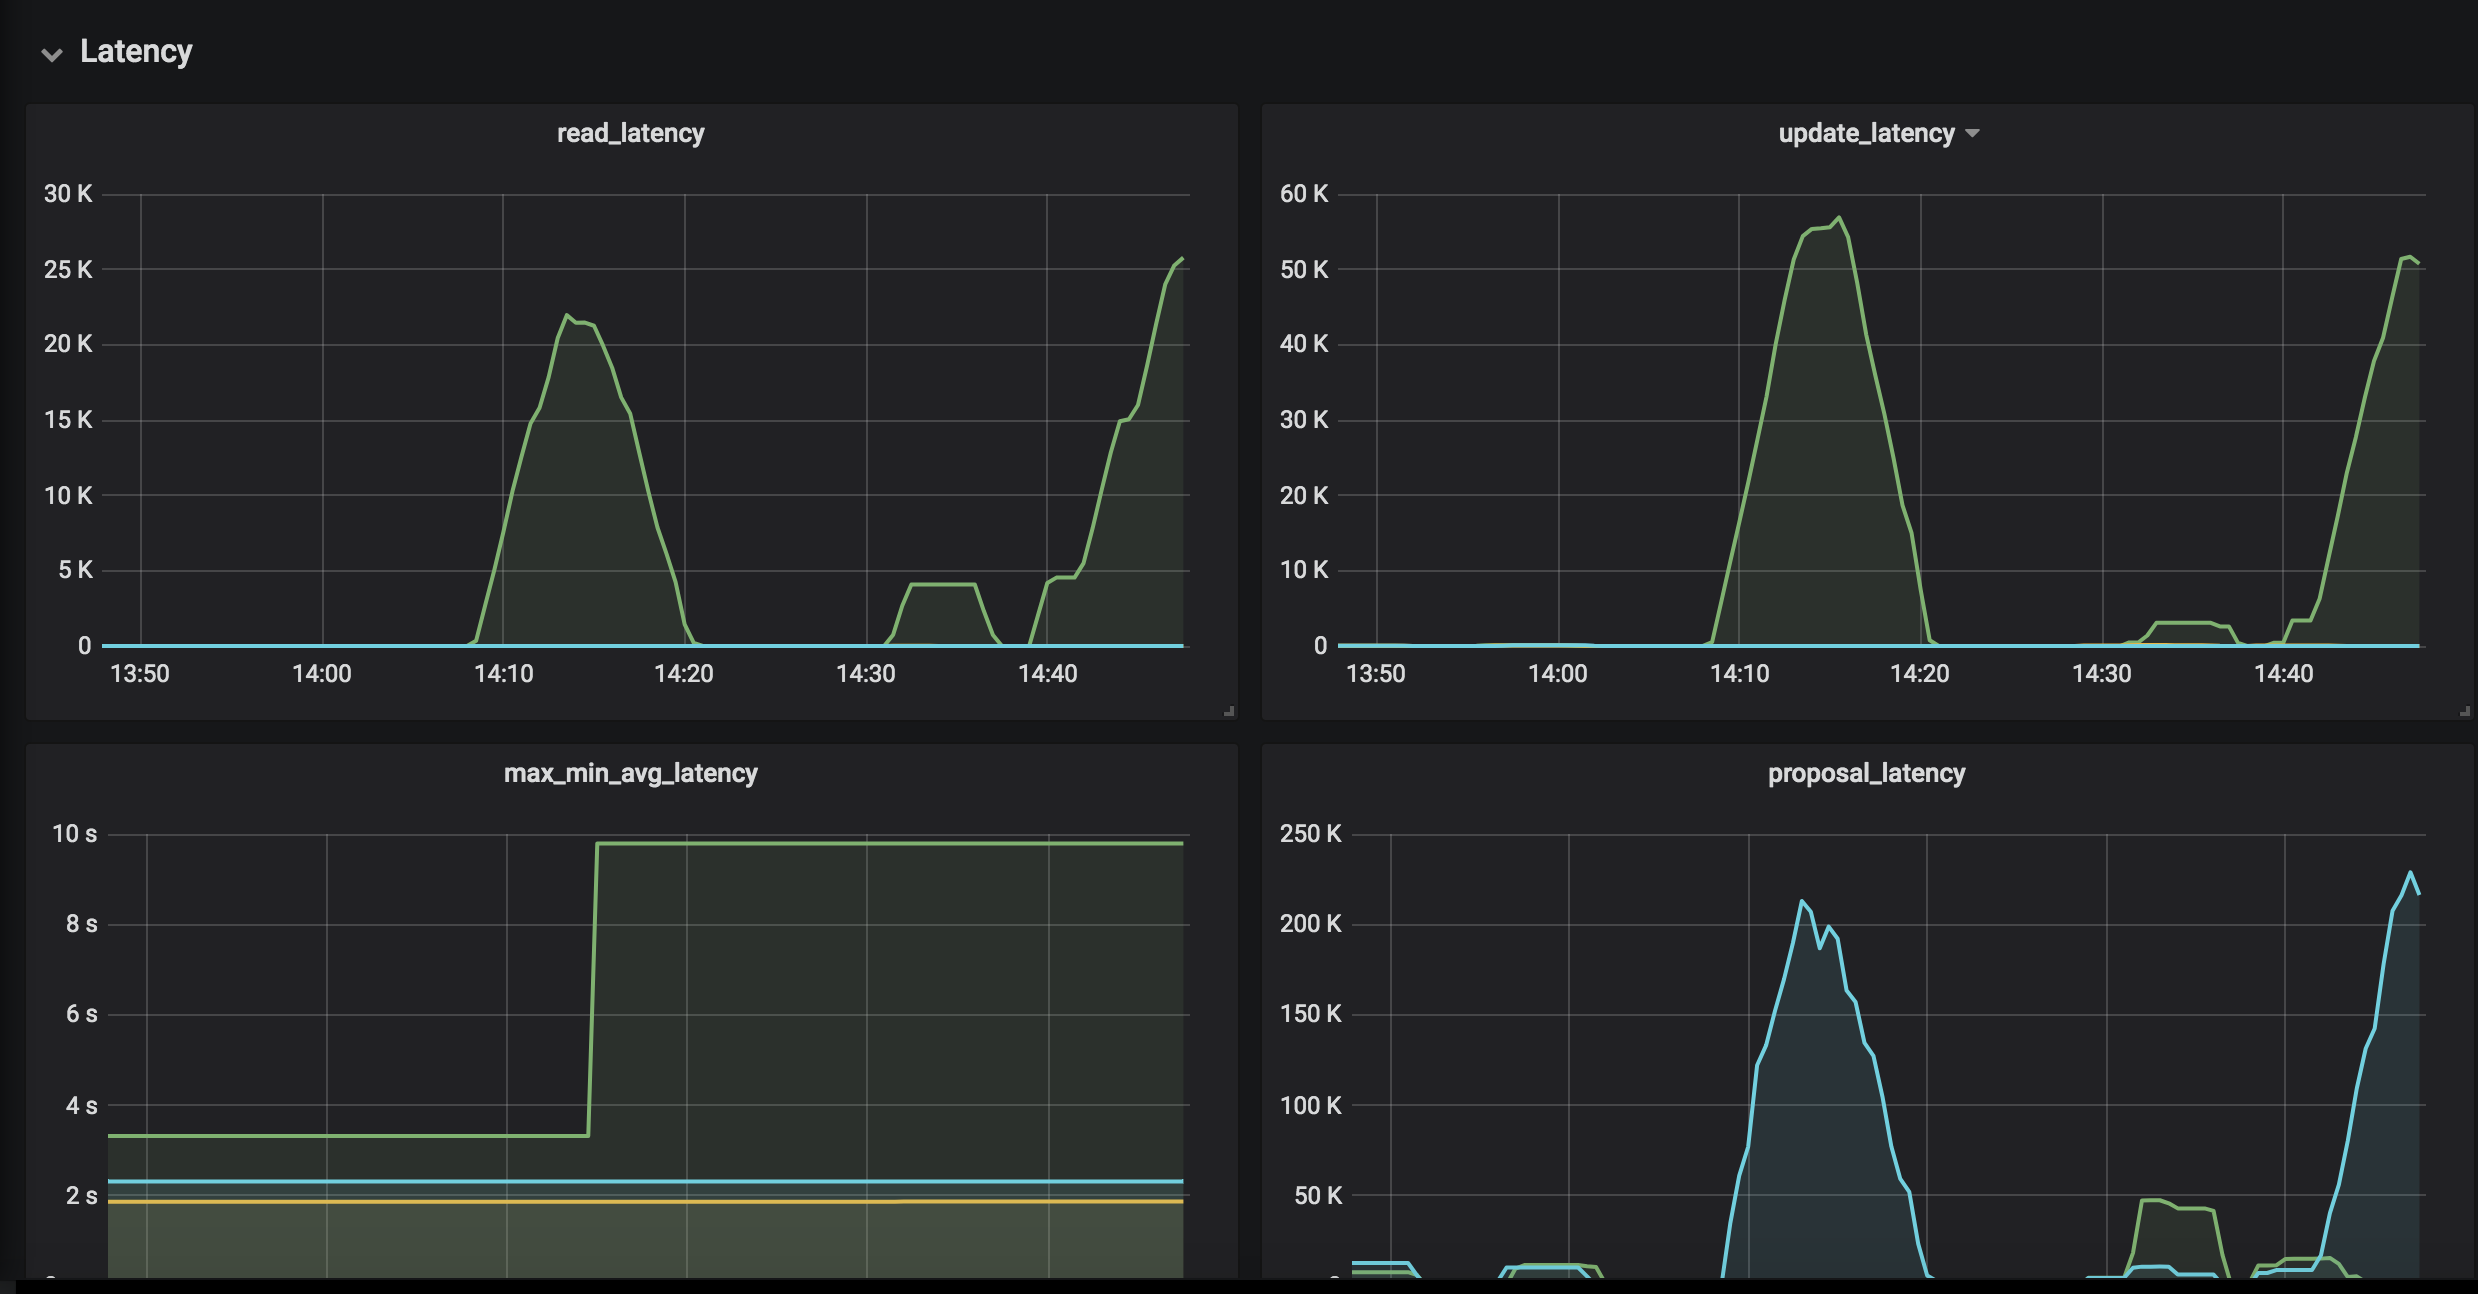
- Use rate() to react the fluctuation of data for total time summary metric
- Have a better classification by checking the source codes to know what every metric wants to do
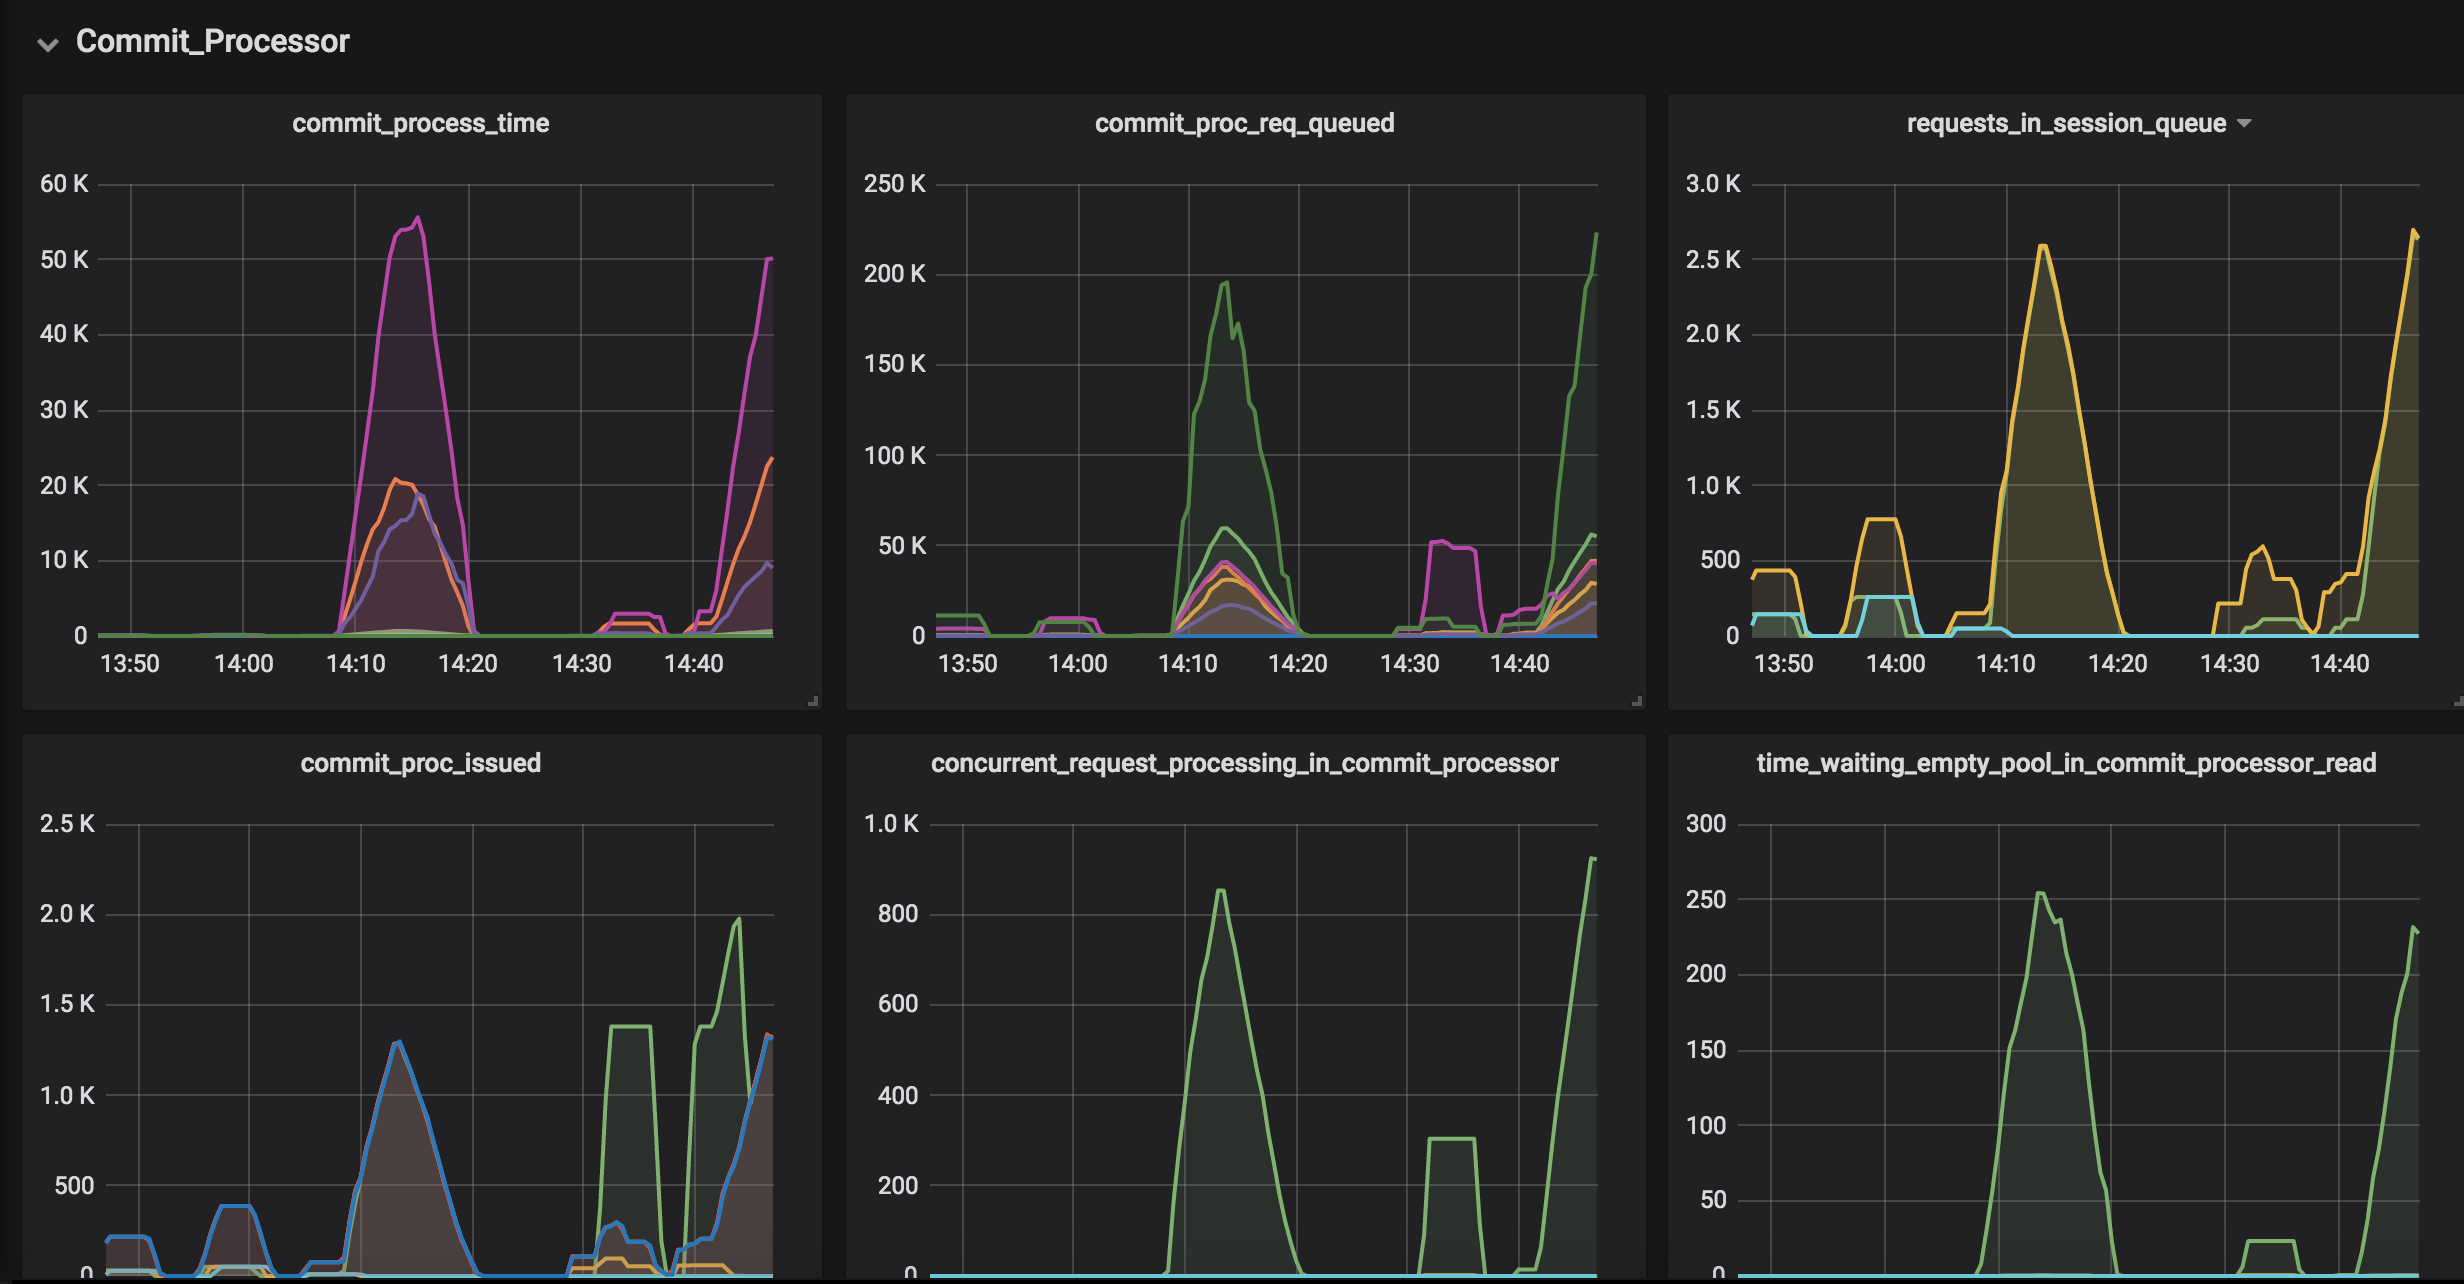
- The metrics in the CommitProcessor are placed the same order with the source code for a better observation for the workflow of CommitProcessor
- Use an unit(e.g., ms/byte) for metric graph
- Prioritize the metrics in the same panel
Compatibility Test: - Tested with grafana-6.x(6.2.2); grafana-7.x(7.0.5)
Data source config
Collector type:
Collector plugins:
Collector config:
Revisions
Upload an updated version of an exported dashboard.json file from Grafana
| Revision | Description | Created | |
|---|---|---|---|
| Download |
Metrics Endpoint (Prometheus)
Easily monitor any Prometheus-compatible and publicly accessible metrics URL with Grafana Cloud's out-of-the-box monitoring solution.
Learn more