Flink Dashboard
Flink dashboard using the Prometheus exporter. https://ci.apache.org/projects/flink/flink-docs-stable/monitoring/metrics.html#prometheus-orgapacheflinkmetricsprometheusprometheusreporter
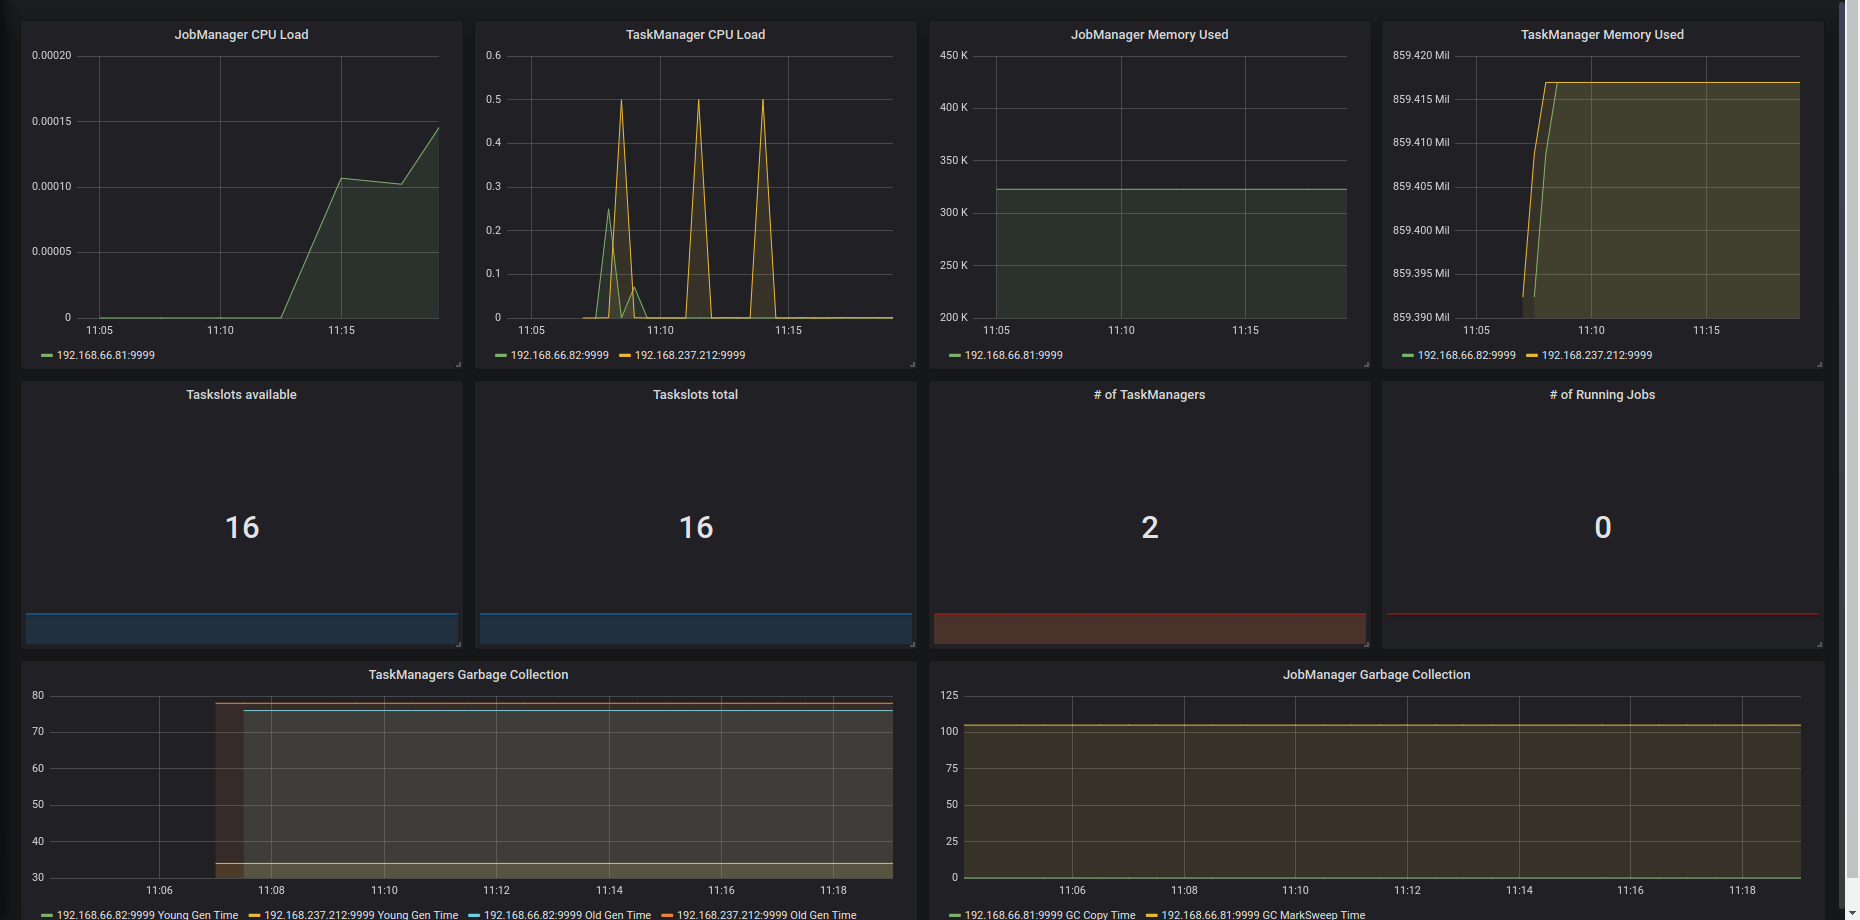
The Flink Dashboard dashboard uses the prometheus data source to create a Grafana dashboard with the graph and singlestat panels.
Data source config
Collector type:
Collector plugins:
Collector config:
Revisions
Upload an updated version of an exported dashboard.json file from Grafana
| Revision | Description | Created | |
|---|---|---|---|
| Download |