Proxmox via Prometheus
Proxmox Virtual Environment Dashboard
In case of problems/suggestions: get in touch, open an issue on GitHub.
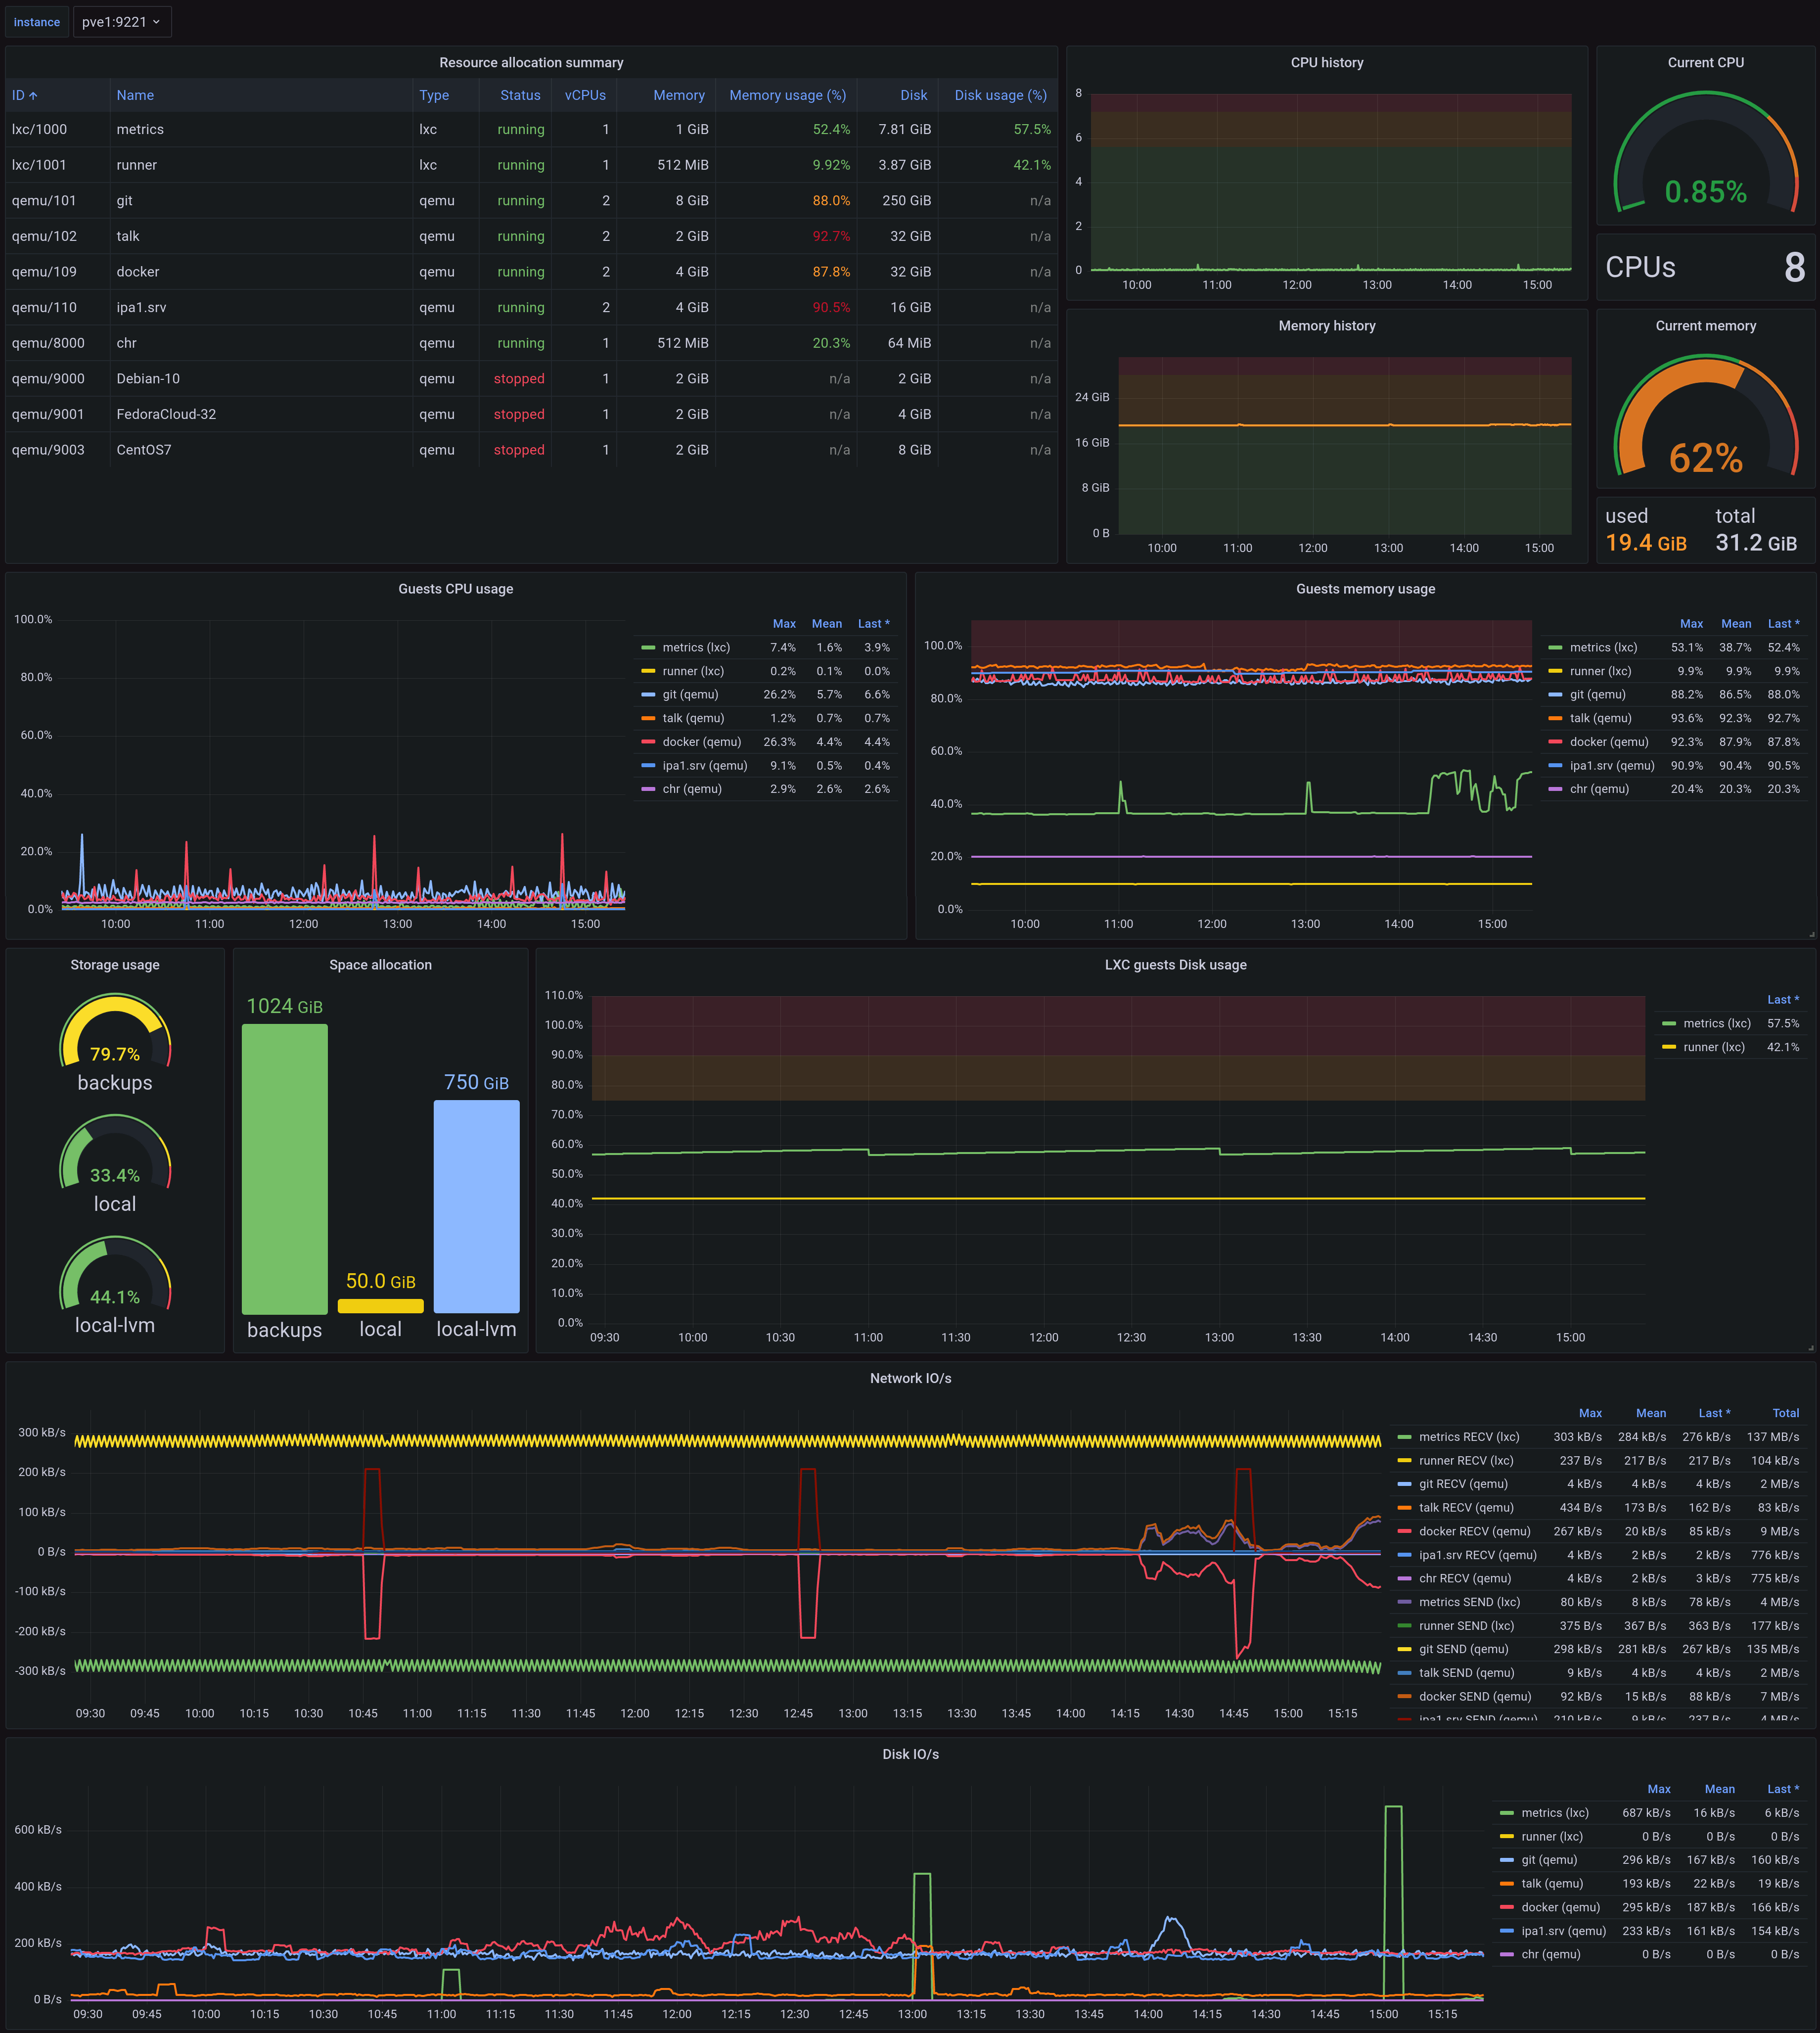
This dashboards shows node-level information (current and historical CPU and memory load), as well as storage information (each storage allocation and usage). It has a summary of resource allocation and usage on all the Proxmox guests, and time series for disk usage (for LXC containers), memory usage, CPU usage, disk IO and network IO for each of the guests.
The dashboard is fed by a Prometheus data source, populated by a prometheus-pve-exporter data source. The original version was developed on a 2.10.0 exporter version.
Since the PVE exporter requires necessarity a different metrics URL for each instance of PVE, the dashboard is templatized on the instance variable.
Data source config
Collector config:
Upload an updated version of an exported dashboard.json file from Grafana
| Revision | Description | Created | |
|---|---|---|---|
| Download |
Metrics Endpoint (Prometheus)
Easily monitor any Prometheus-compatible and publicly accessible metrics URL with Grafana Cloud's out-of-the-box monitoring solution.
Learn more