
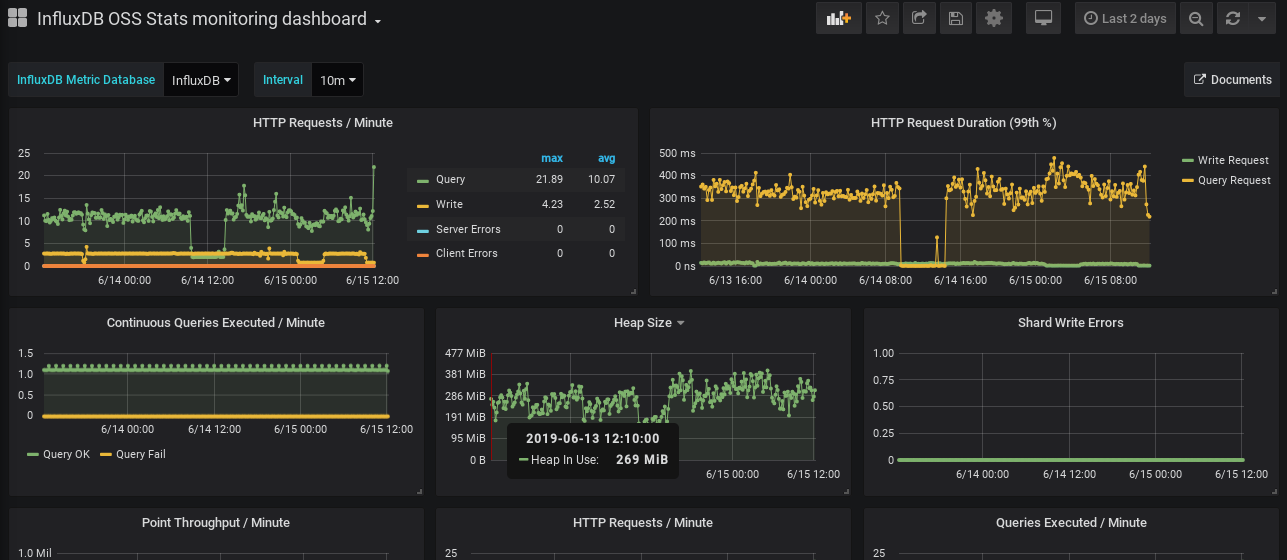
InfluxDB OSS Stats monitoring dashboard
The commonly monitored metrics from the built-in `_internal` database of InfluxDB OSS.
About this dashboard
The commonly monitored metrics from the built-in _internal database of InfluxDB OSS.
Please create new DataSource for _internal database.
Metrics
- HTTP Requests / Minute
- HTTP Request Duration (99th %)
- Continuous Queries Executed / Minute
- Heap Size
- Shard Write Errors
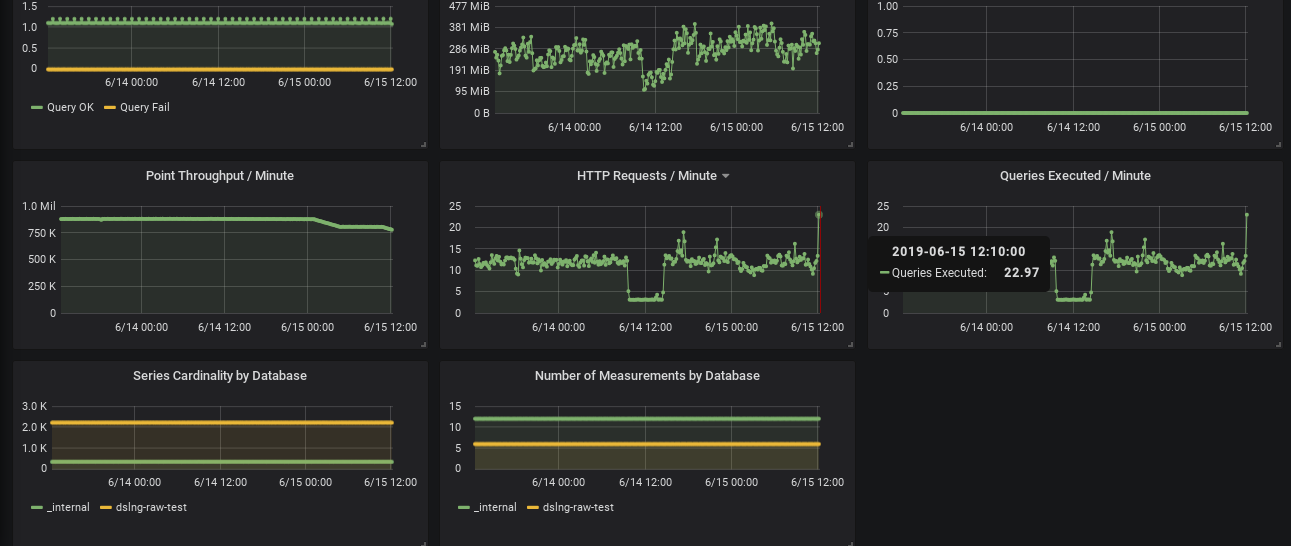
- Point Throughput / Minute by Hostname
- HTTP Requests / Minute
- Queries Executed / Minute
- Series Cardinality by Database
- Number of Measurements by Database
Setup
Create the Data Source for _internal of influxDB.
- Select Type: influxdb
- Data Source Naming with
_internal. likeInfluxDB(_internal) - InfluxDB Details:
- Database:
_internal
- Database:
History
- Rev.3
- add hostname variable.
- Rev.2
- Group with hostname and show on legend.
- Add description for each panels.
- Add link for grafana.com.
- Rev.1 Initial version.
Data source config
Collector type:
Collector plugins:
Collector config:
Dashboard revisions
Upload an updated version of an exported dashboard.json file from Grafana
| Revision | Decscription | Created | |
|---|---|---|---|
| Download |
Sign up for Grafana Cloud

Get up and running in minutes with the Grafana Cloud free tier, which includes free forever 10k metrics, 50GB logs, 50GB traces, 500 VUh, and more.
Get this dashboard
Data source:
Dependencies: