etcd-clusters-as-pod
Etcd Dashboard from Prometheus for clusters running etcd as Kubernetes Pods
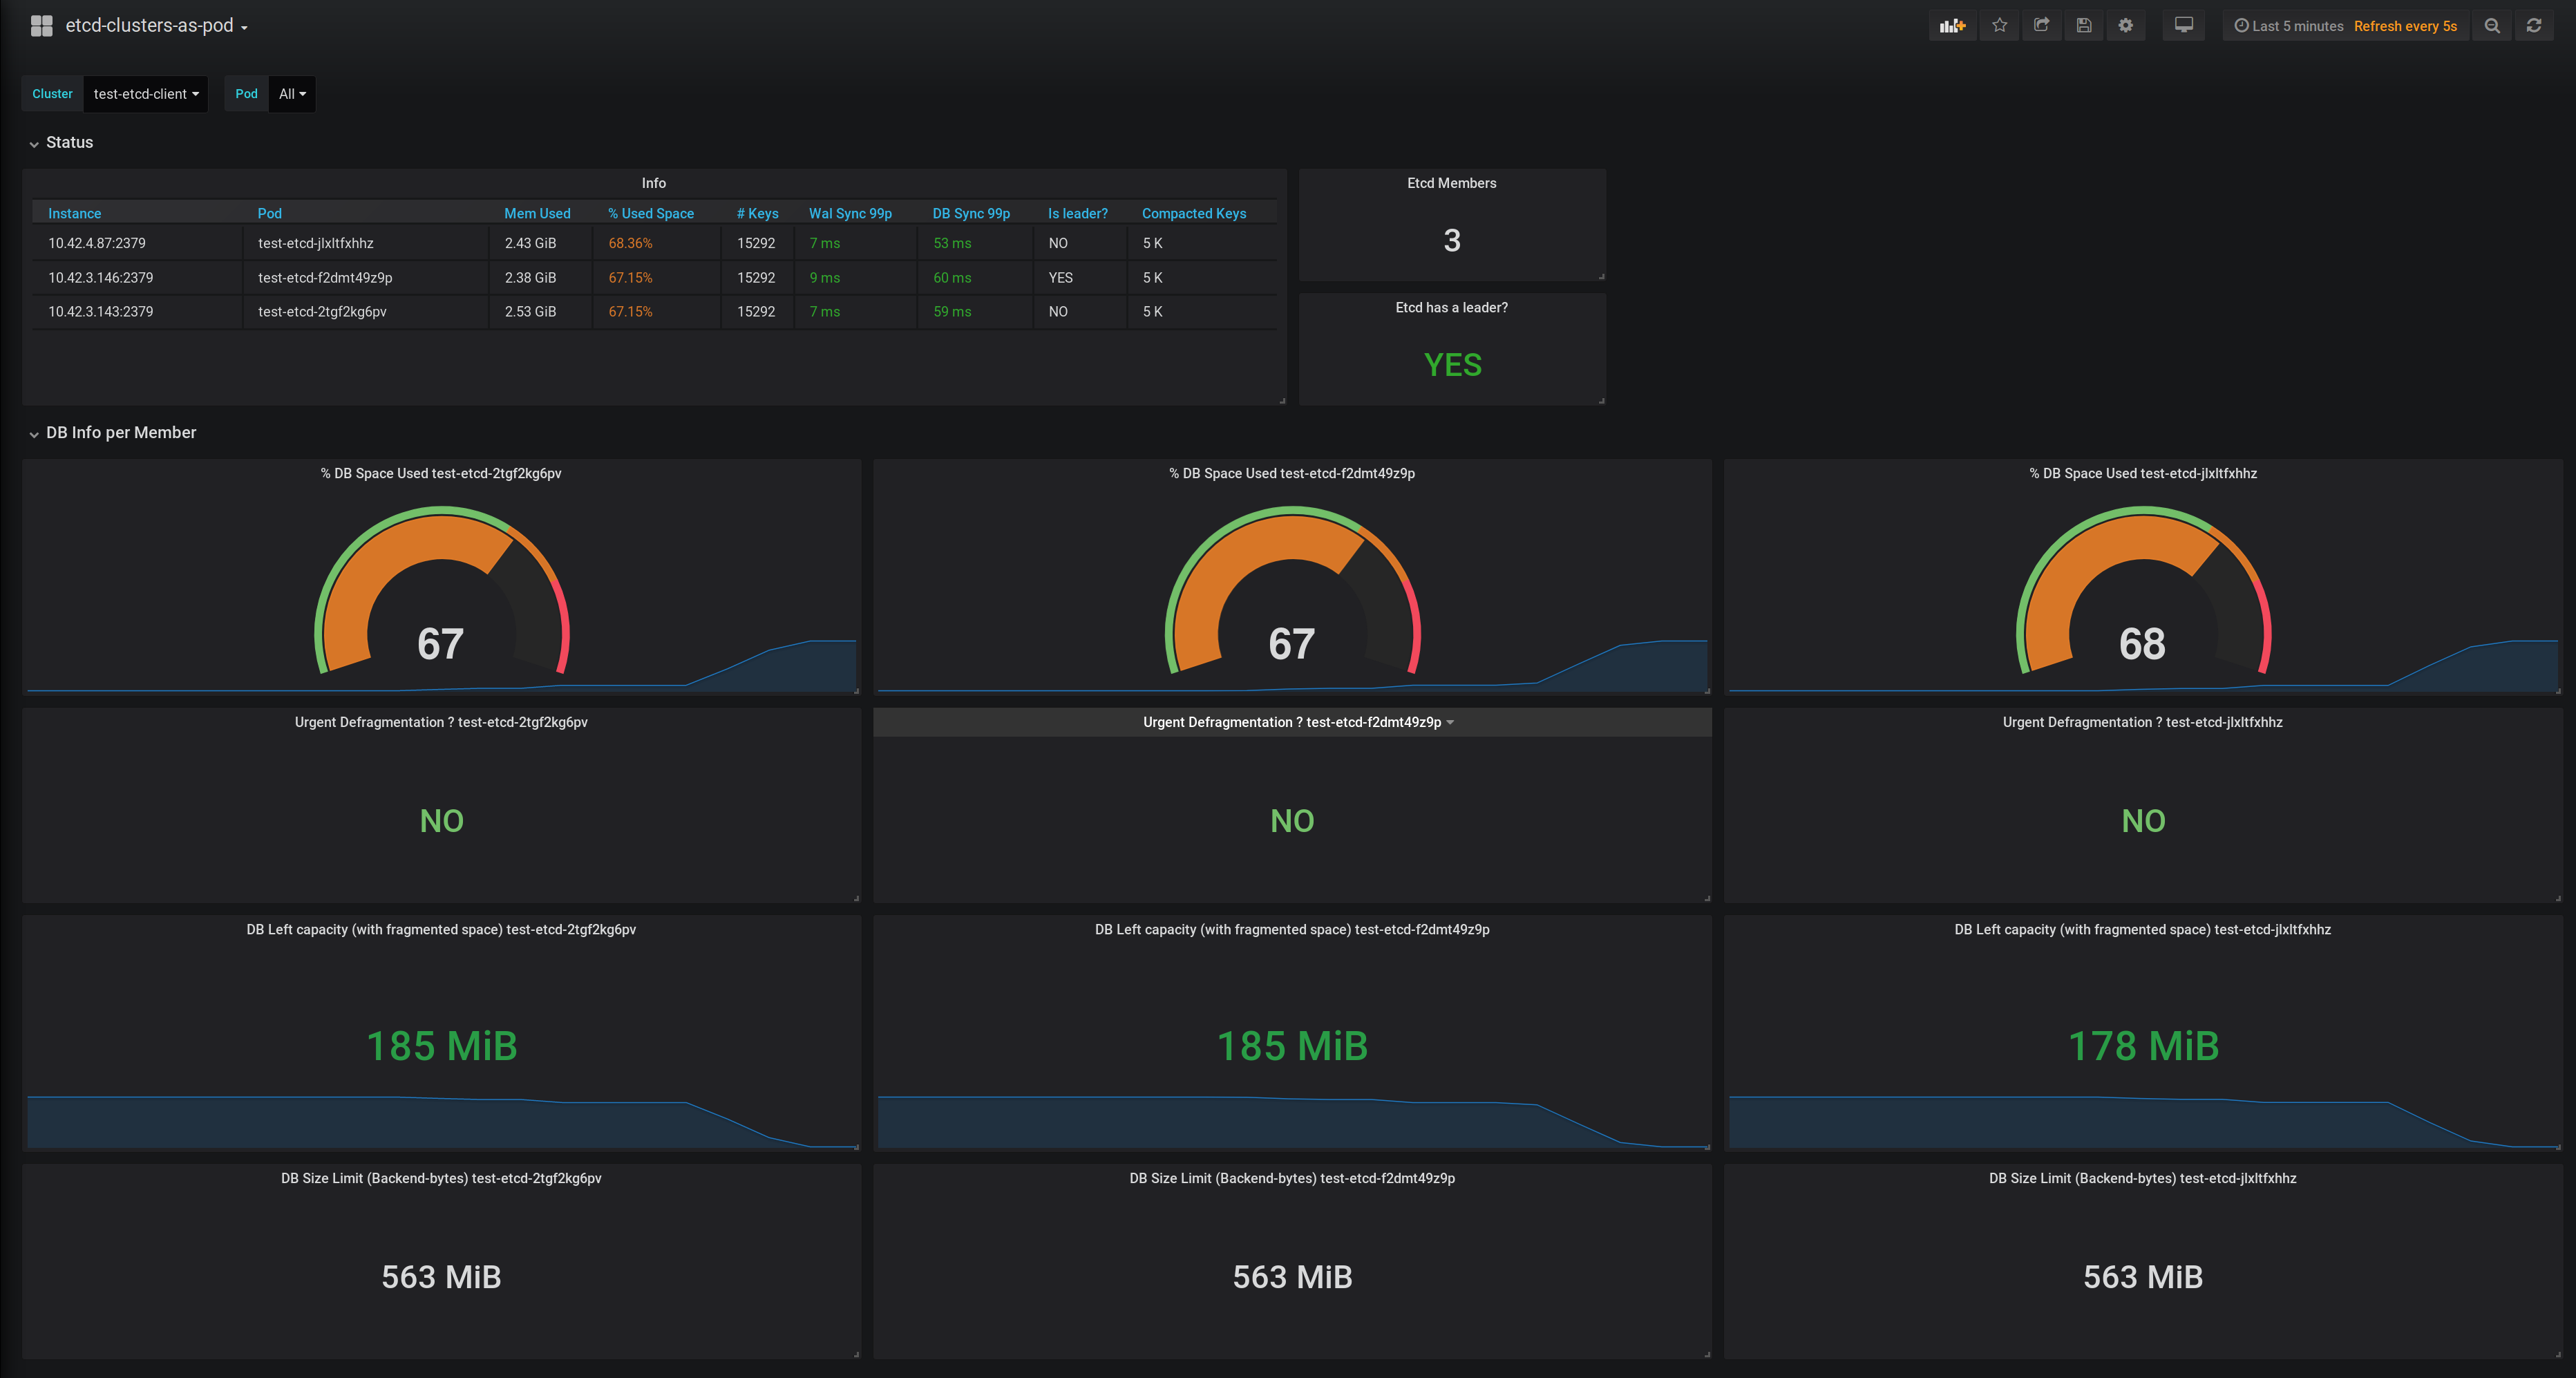
Etcd Dashboard from Prometheus for clusters running etcd as Kubernetes Pods.
Information:
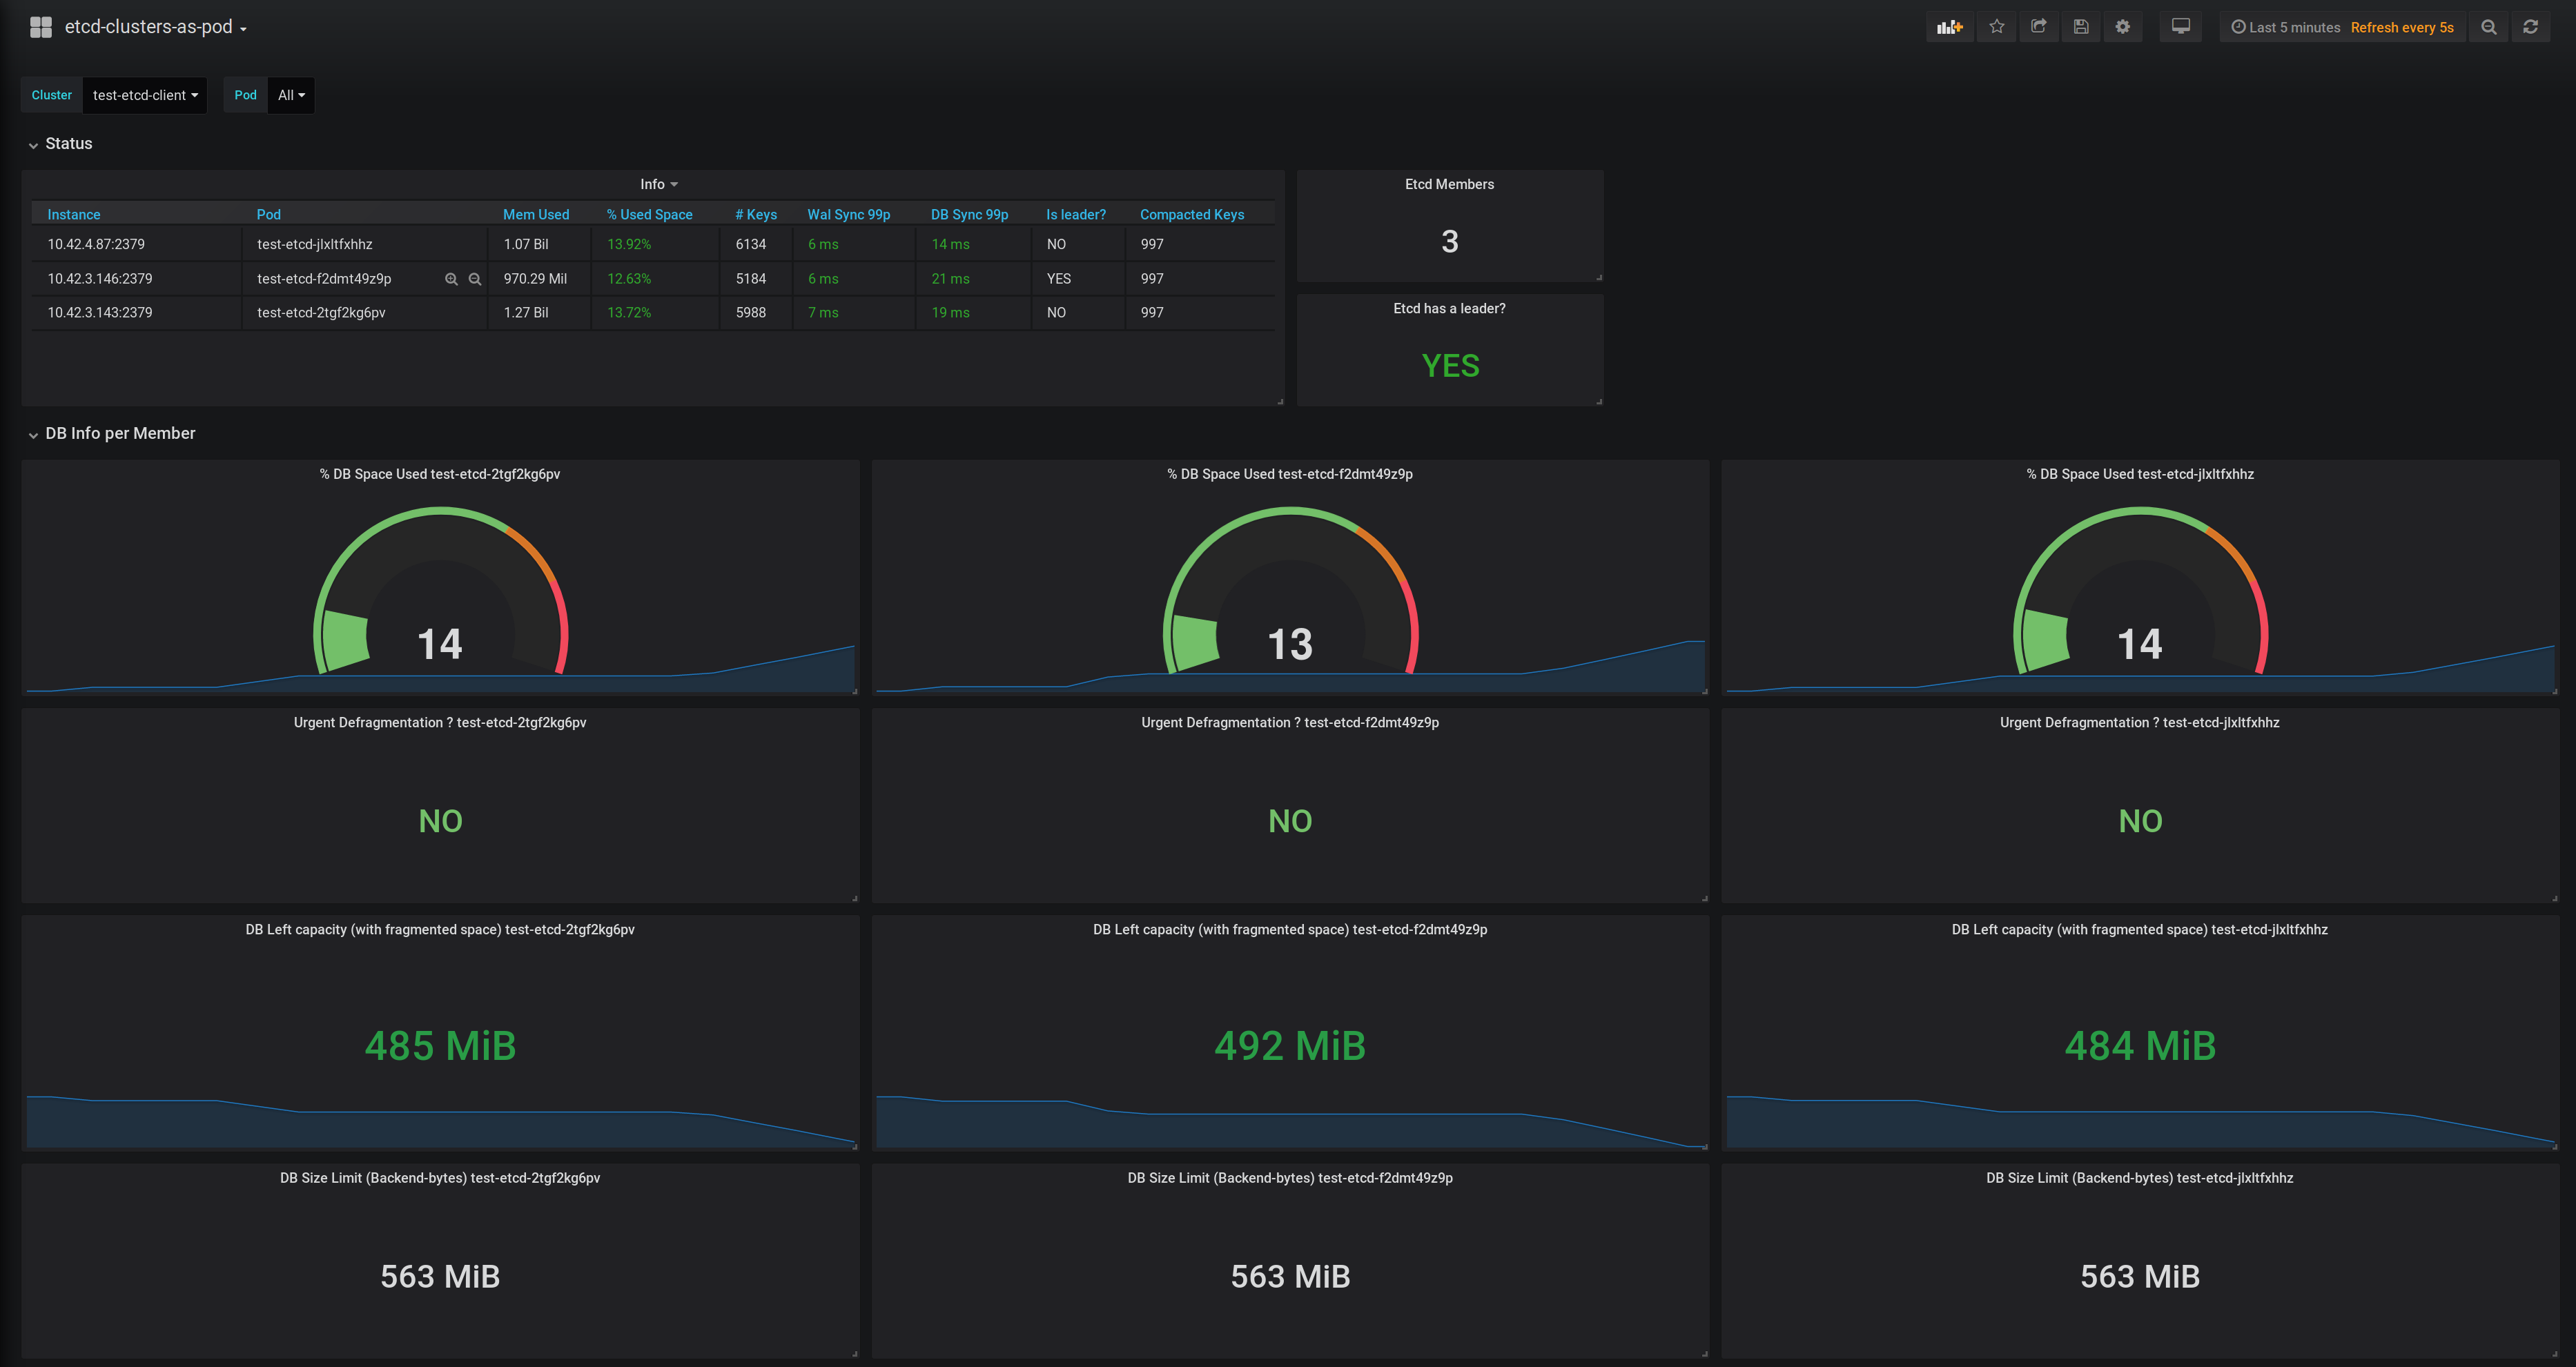
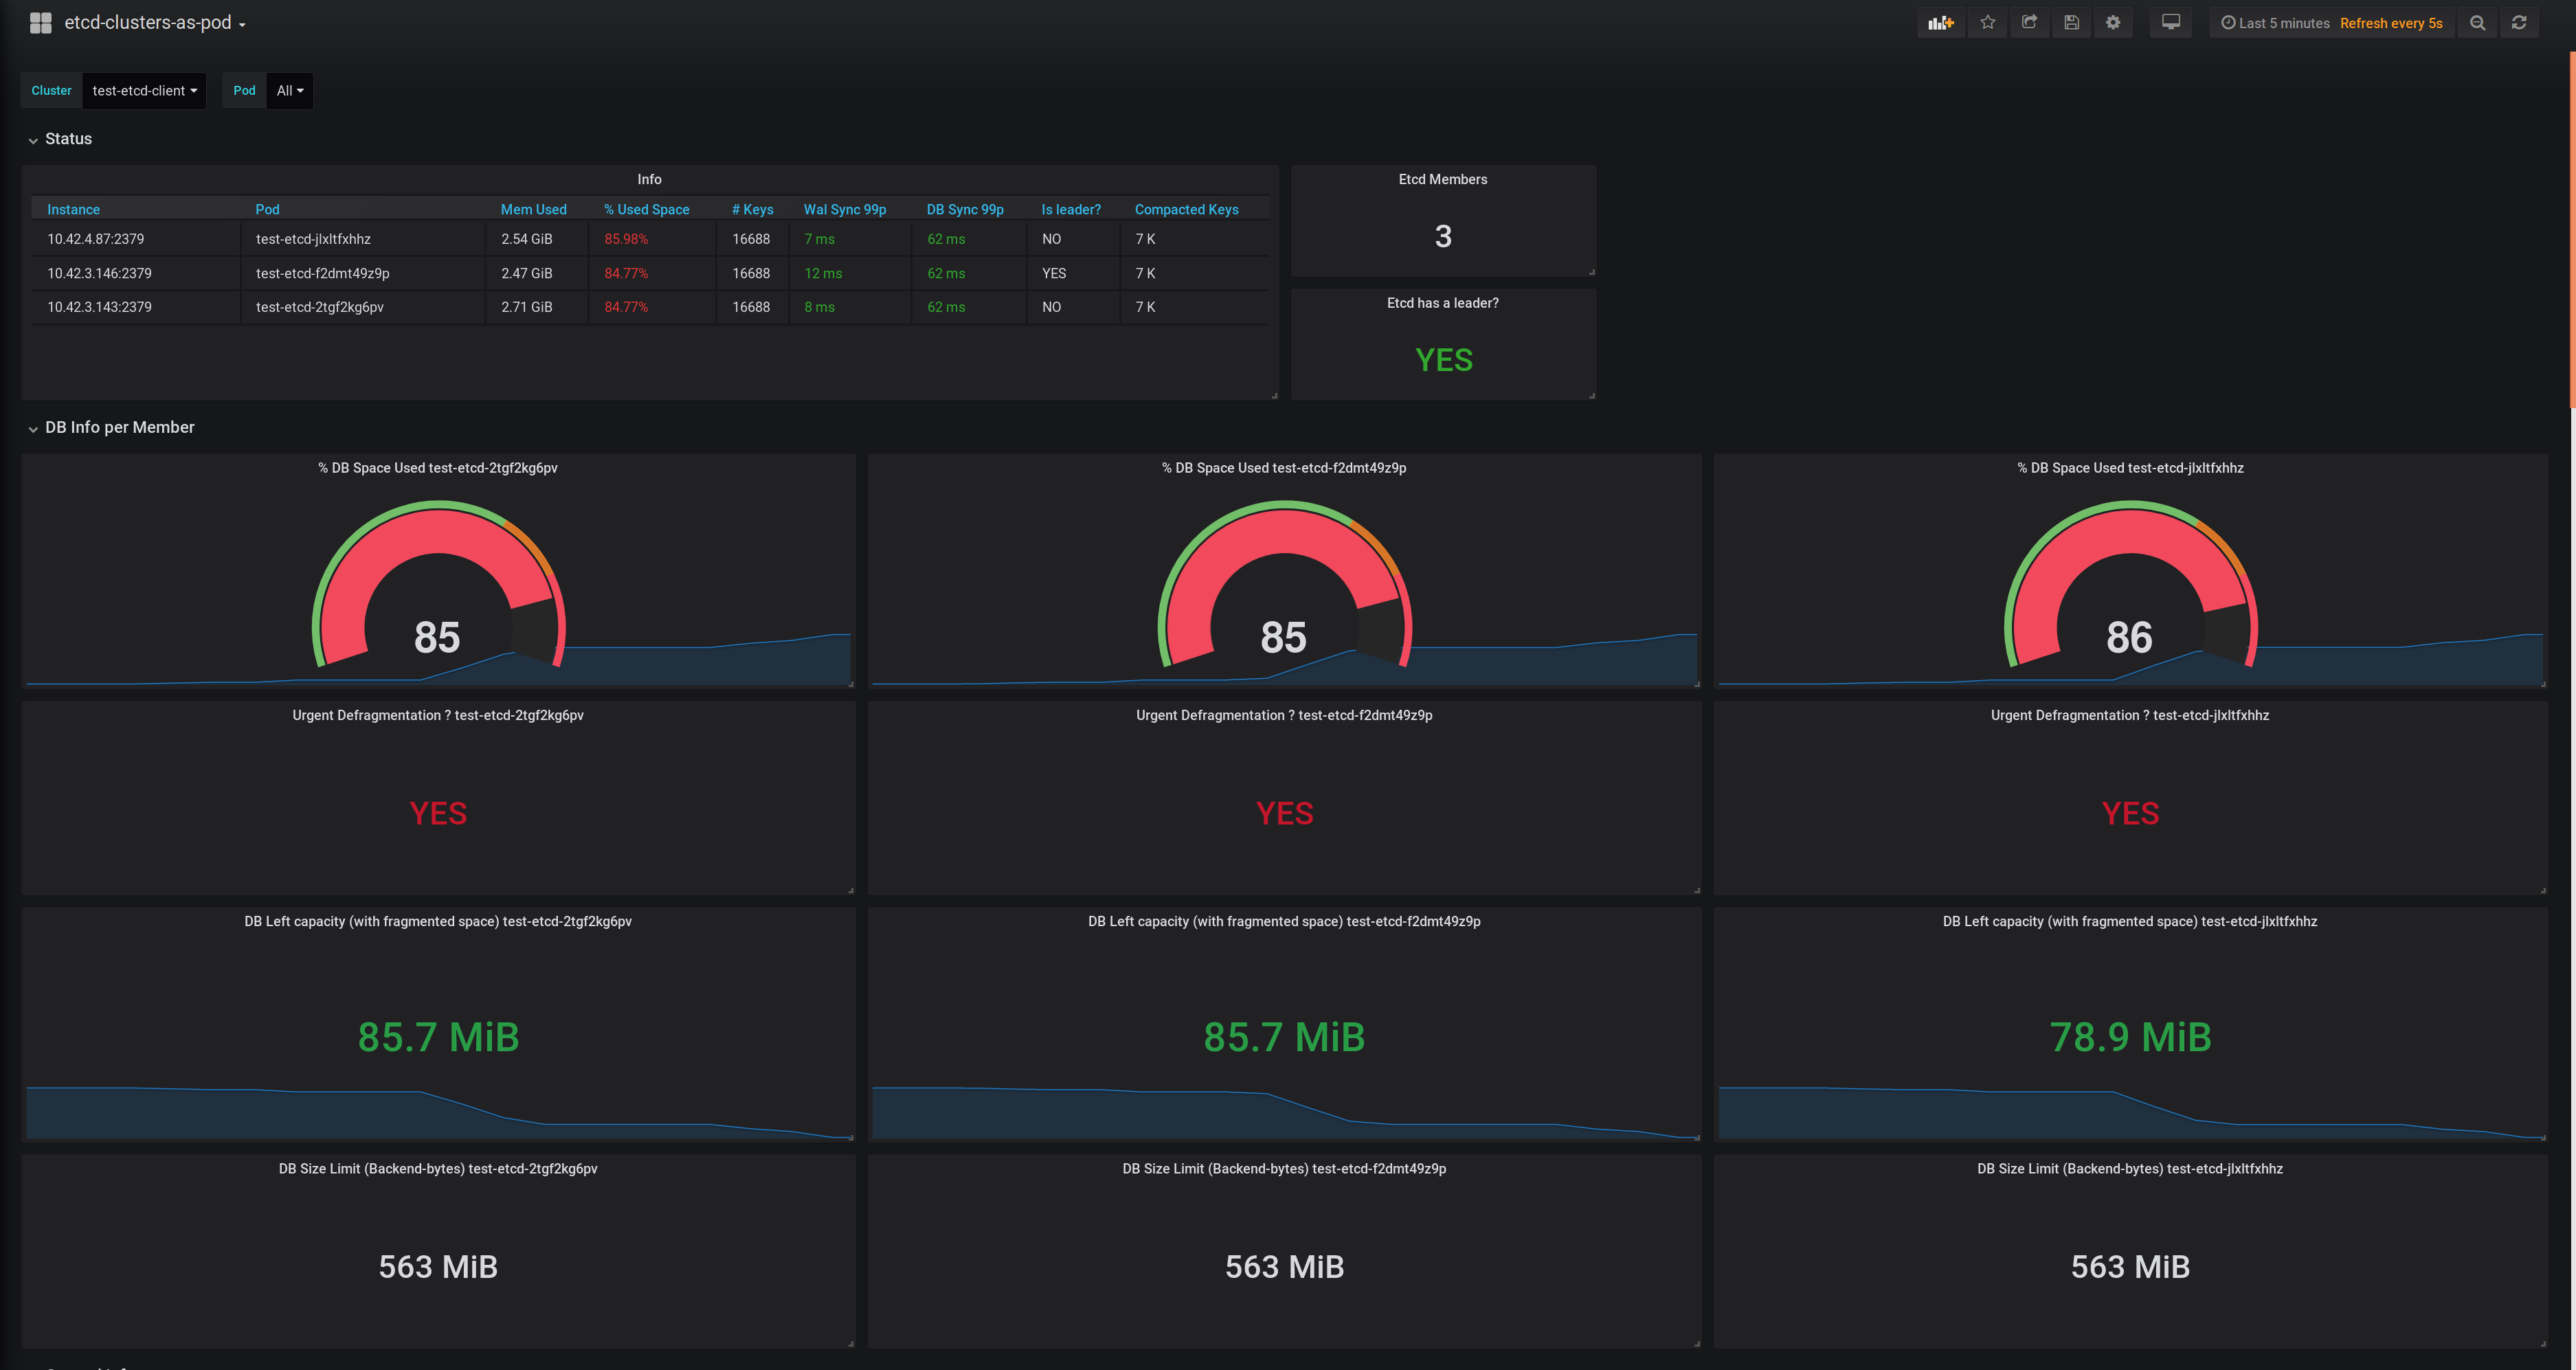
- General Status
- Per member Ops info such as if a defragmentation is needed, or how much space left the DB have between used space and available quota backend bytes.
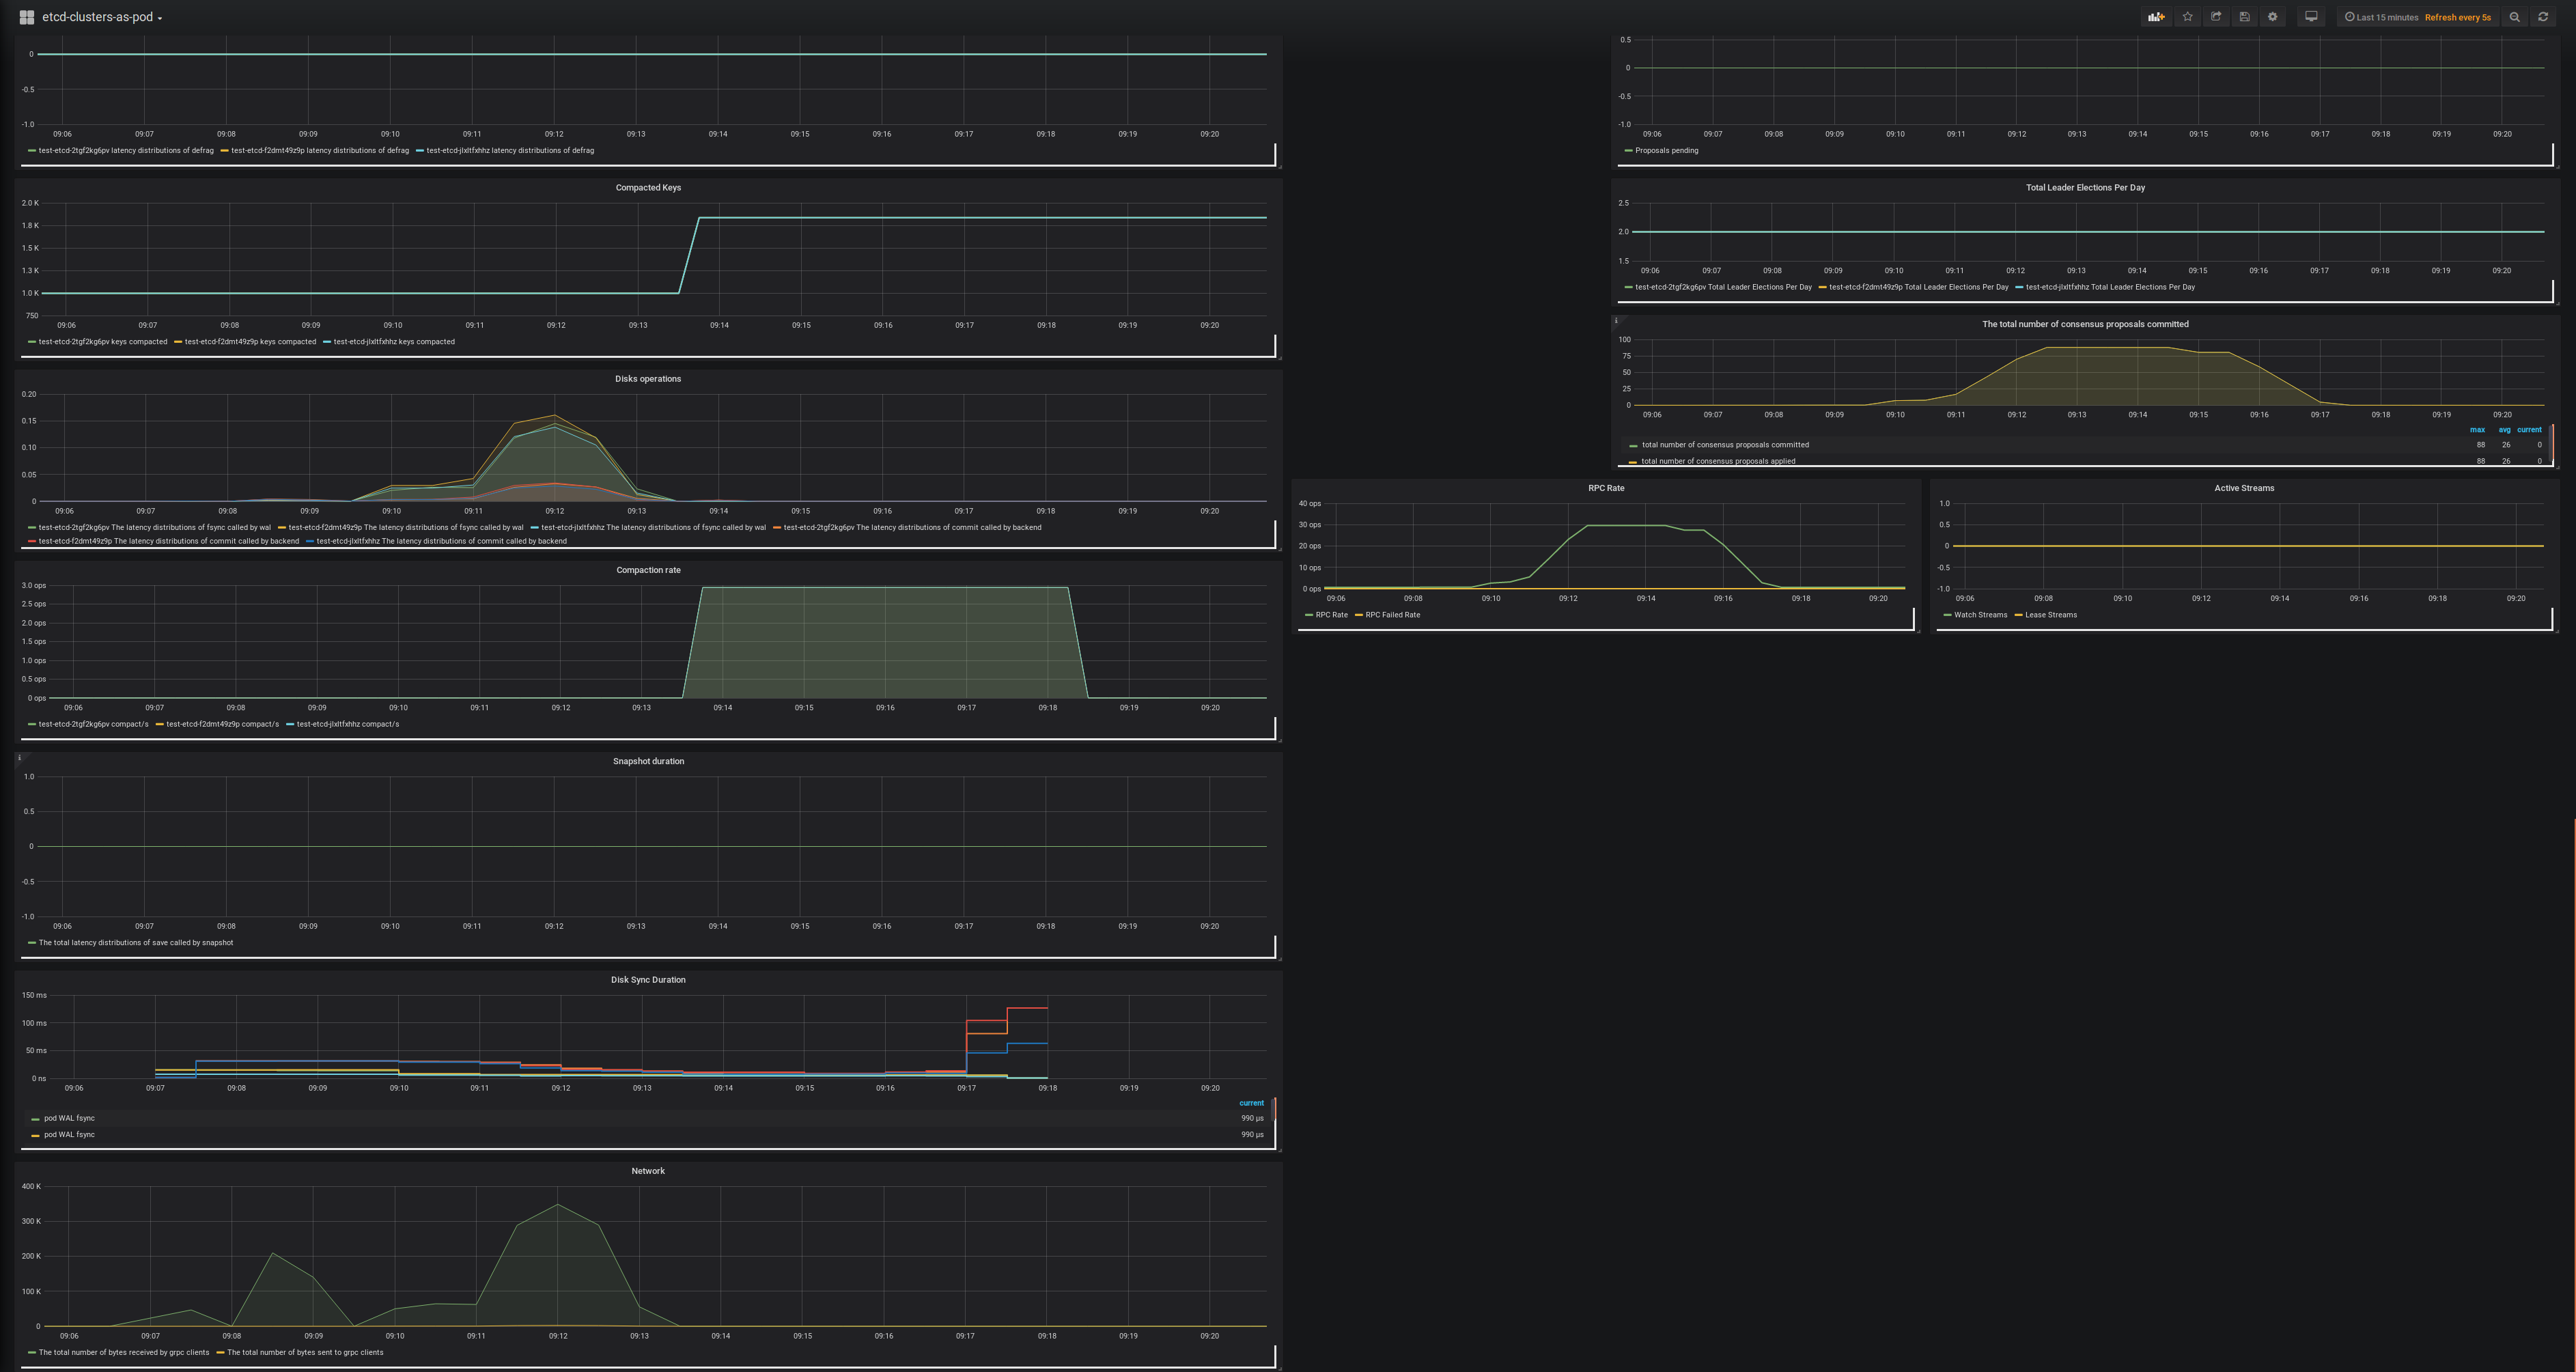
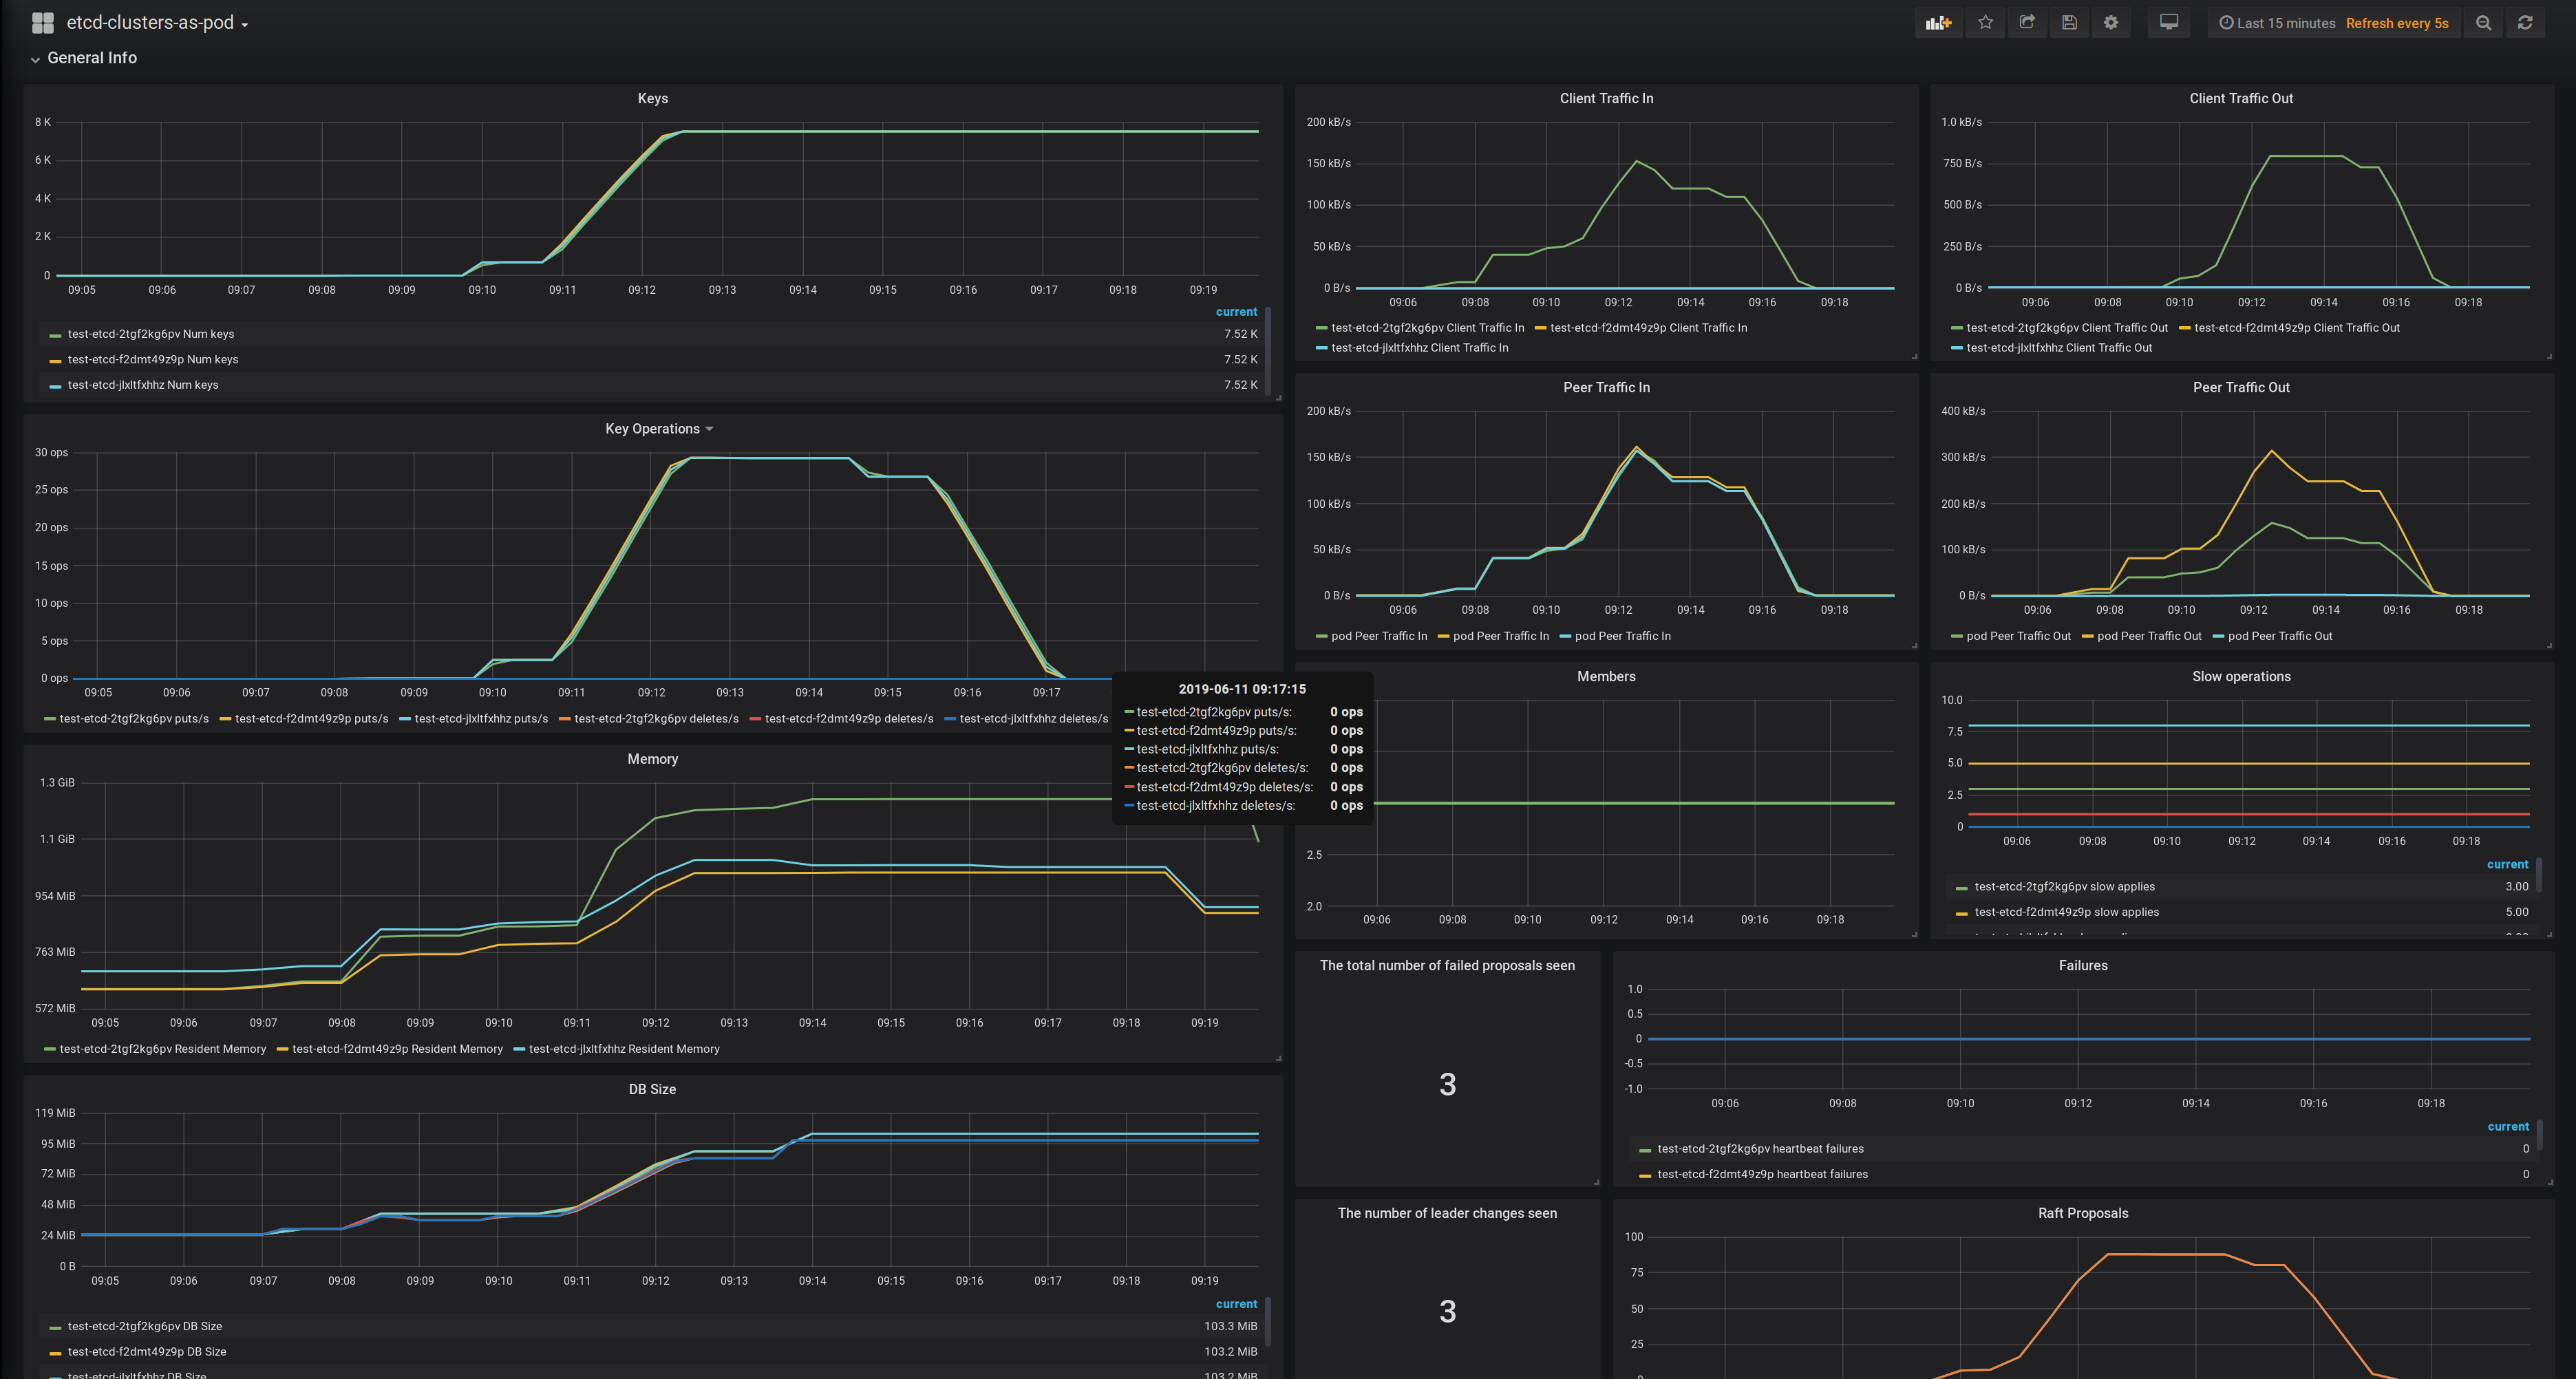
- General observability about keys, client traffic, peer traffic, I/O latency, etc.
Data source config
Collector type:
Collector plugins:
Collector config:
Revisions
Upload an updated version of an exported dashboard.json file from Grafana
| Revision | Description | Created | |
|---|---|---|---|
| Download |
etcd
Easily monitor etcd, a distributed key-value store, ewith Grafana Cloud's out-of-the-box monitoring solution.
Learn more