Grafana-Prometheus-Node_Exporter_Host_Metrics_Dashboard
This is a simple Grafana Dashboard to display Host Metrics such CPU, Memory, DISK IO, Load Average, collected using the Node Exporter
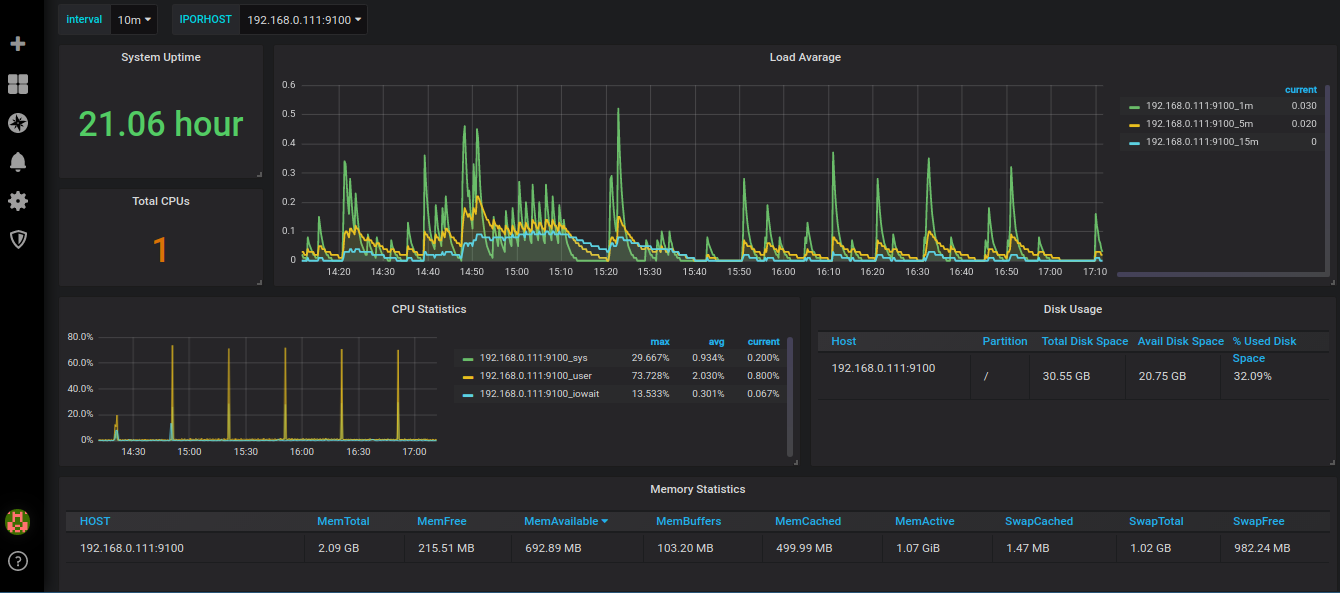
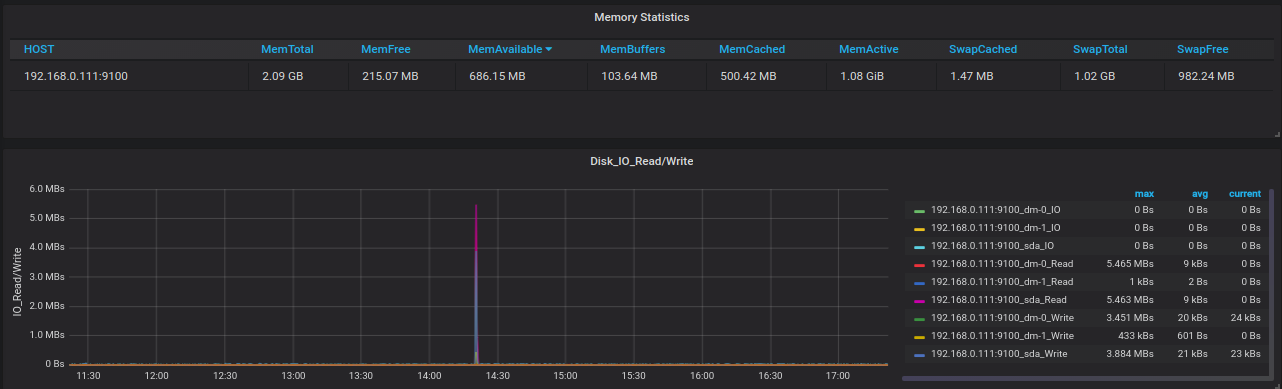
This is a simple Grafana Dashboard to display Host Metrics such CPU, Memory, DISK IO, Load Average, collected using the Prometheus Node Exporter
Data source config
Collector type:
Collector plugins:
Collector config:
Revisions
Upload an updated version of an exported dashboard.json file from Grafana
| Revision | Description | Created | |
|---|---|---|---|
| Download |
Metrics Endpoint (Prometheus)
Easily monitor any Prometheus-compatible and publicly accessible metrics URL with Grafana Cloud's out-of-the-box monitoring solution.
Learn more