Linux Hosts Metrics | Base
Basic overview of linux host metrics, based on node_exporter
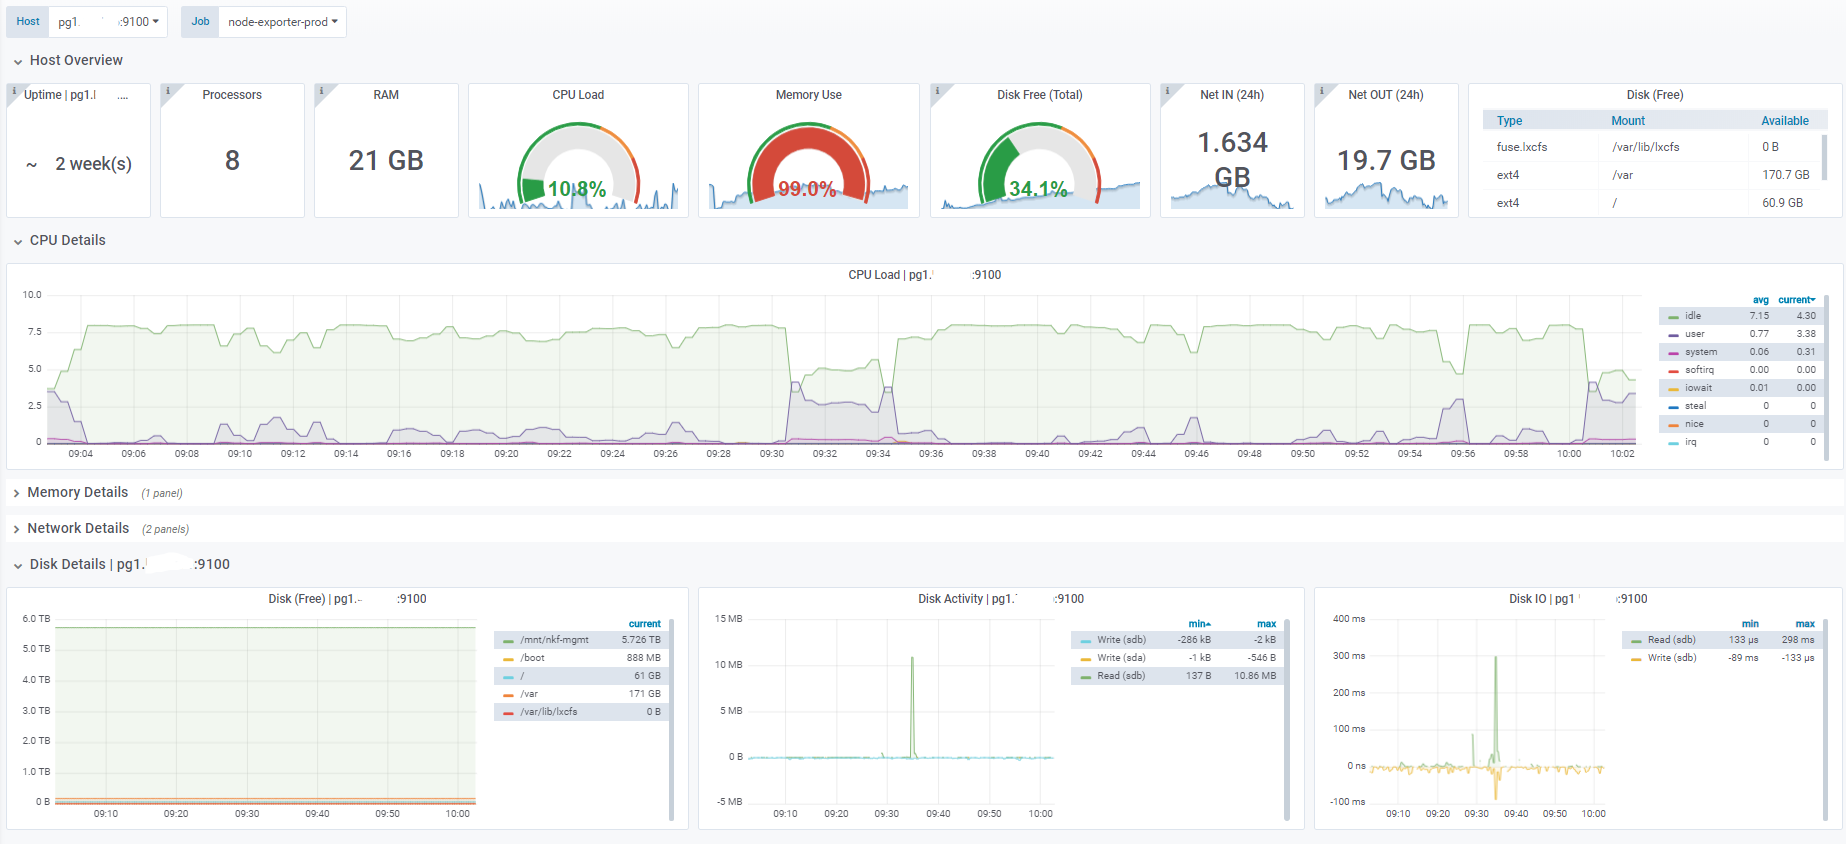
This dashboards gives a basic overview of linux host metrics.
- Host & Job-filters, based on "node_boot_time_seconds" metric
- Multiple instances can be selected/shown at the same time
NOTE: Only tested with a resolution of 1920x1080. The fields/metrics are set to stack vertically when more than 1 node i selected, so you might want to limit the view to only 1 node at a time on lower resolutions
Data source config
Collector type:
Collector plugins:
Collector config:
Revisions
Upload an updated version of an exported dashboard.json file from Grafana
| Revision | Description | Created | |
|---|---|---|---|
| Download |
Linux Server
Monitor Linux with Grafana. Easily monitor your Linux deployment with Grafana Cloud's out-of-the-box monitoring solution.
Learn more