Collectd Graph Panel
Like the original Collectd Graph Panel (PHP frontend), but then as a Dashboard in Grafana with InfluxDB as a data source. Same colors and styling. Currently supported graphs: - Load - CPU - Memory - Swap - Disk Traffic - Disk Usage - Interface Traffic (Original: https://collectd.org/wiki/index.php/Collectd_Graph_Panel)
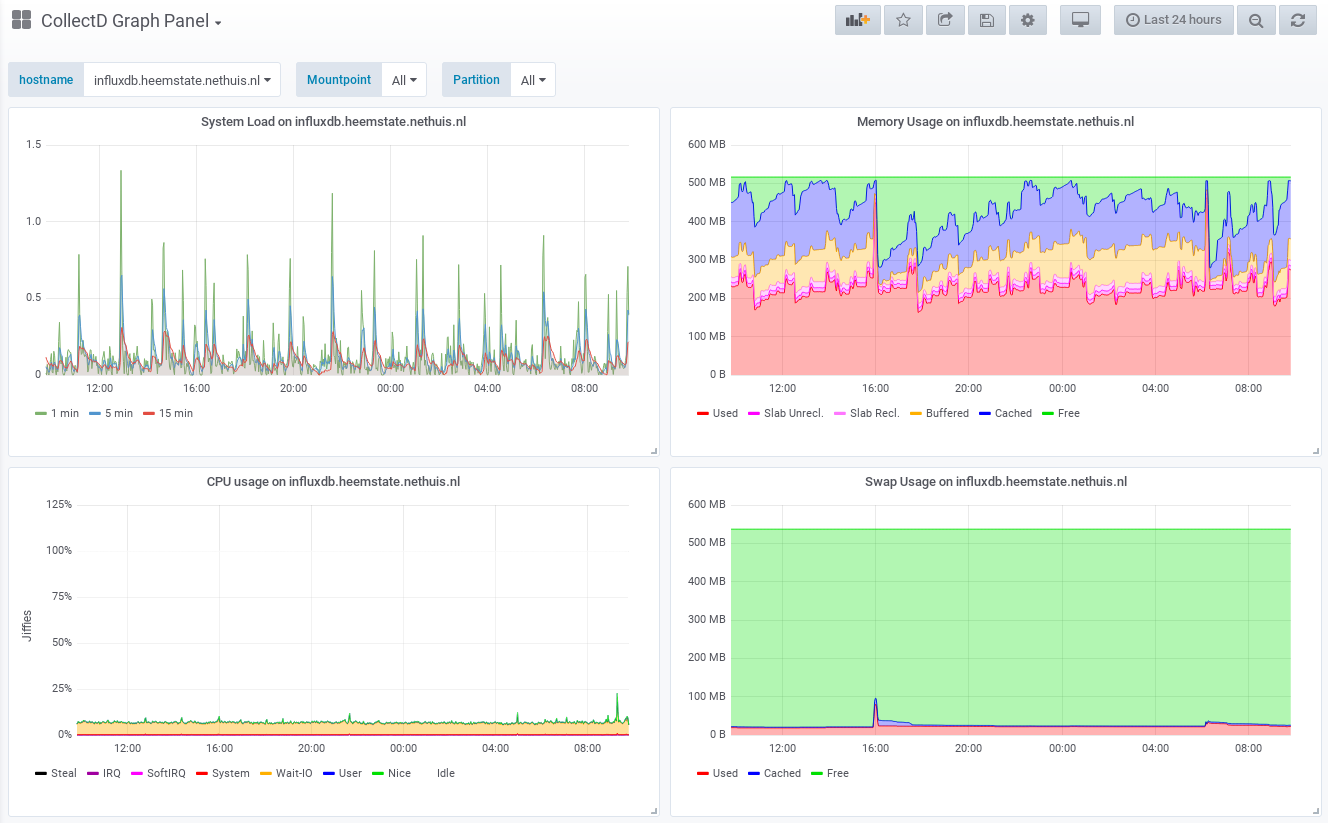
The Collectd Graph Panel dashboard uses the influxdb data source to create a Grafana dashboard with the graph panel.
Data source config
Collector type:
Collector plugins:
Collector config:
Revisions
Upload an updated version of an exported dashboard.json file from Grafana
| Revision | Description | Created | |
|---|---|---|---|
| Download |