Ntpd
Dashboard for ntpd plugin in CollectD sending data to InfluxDB
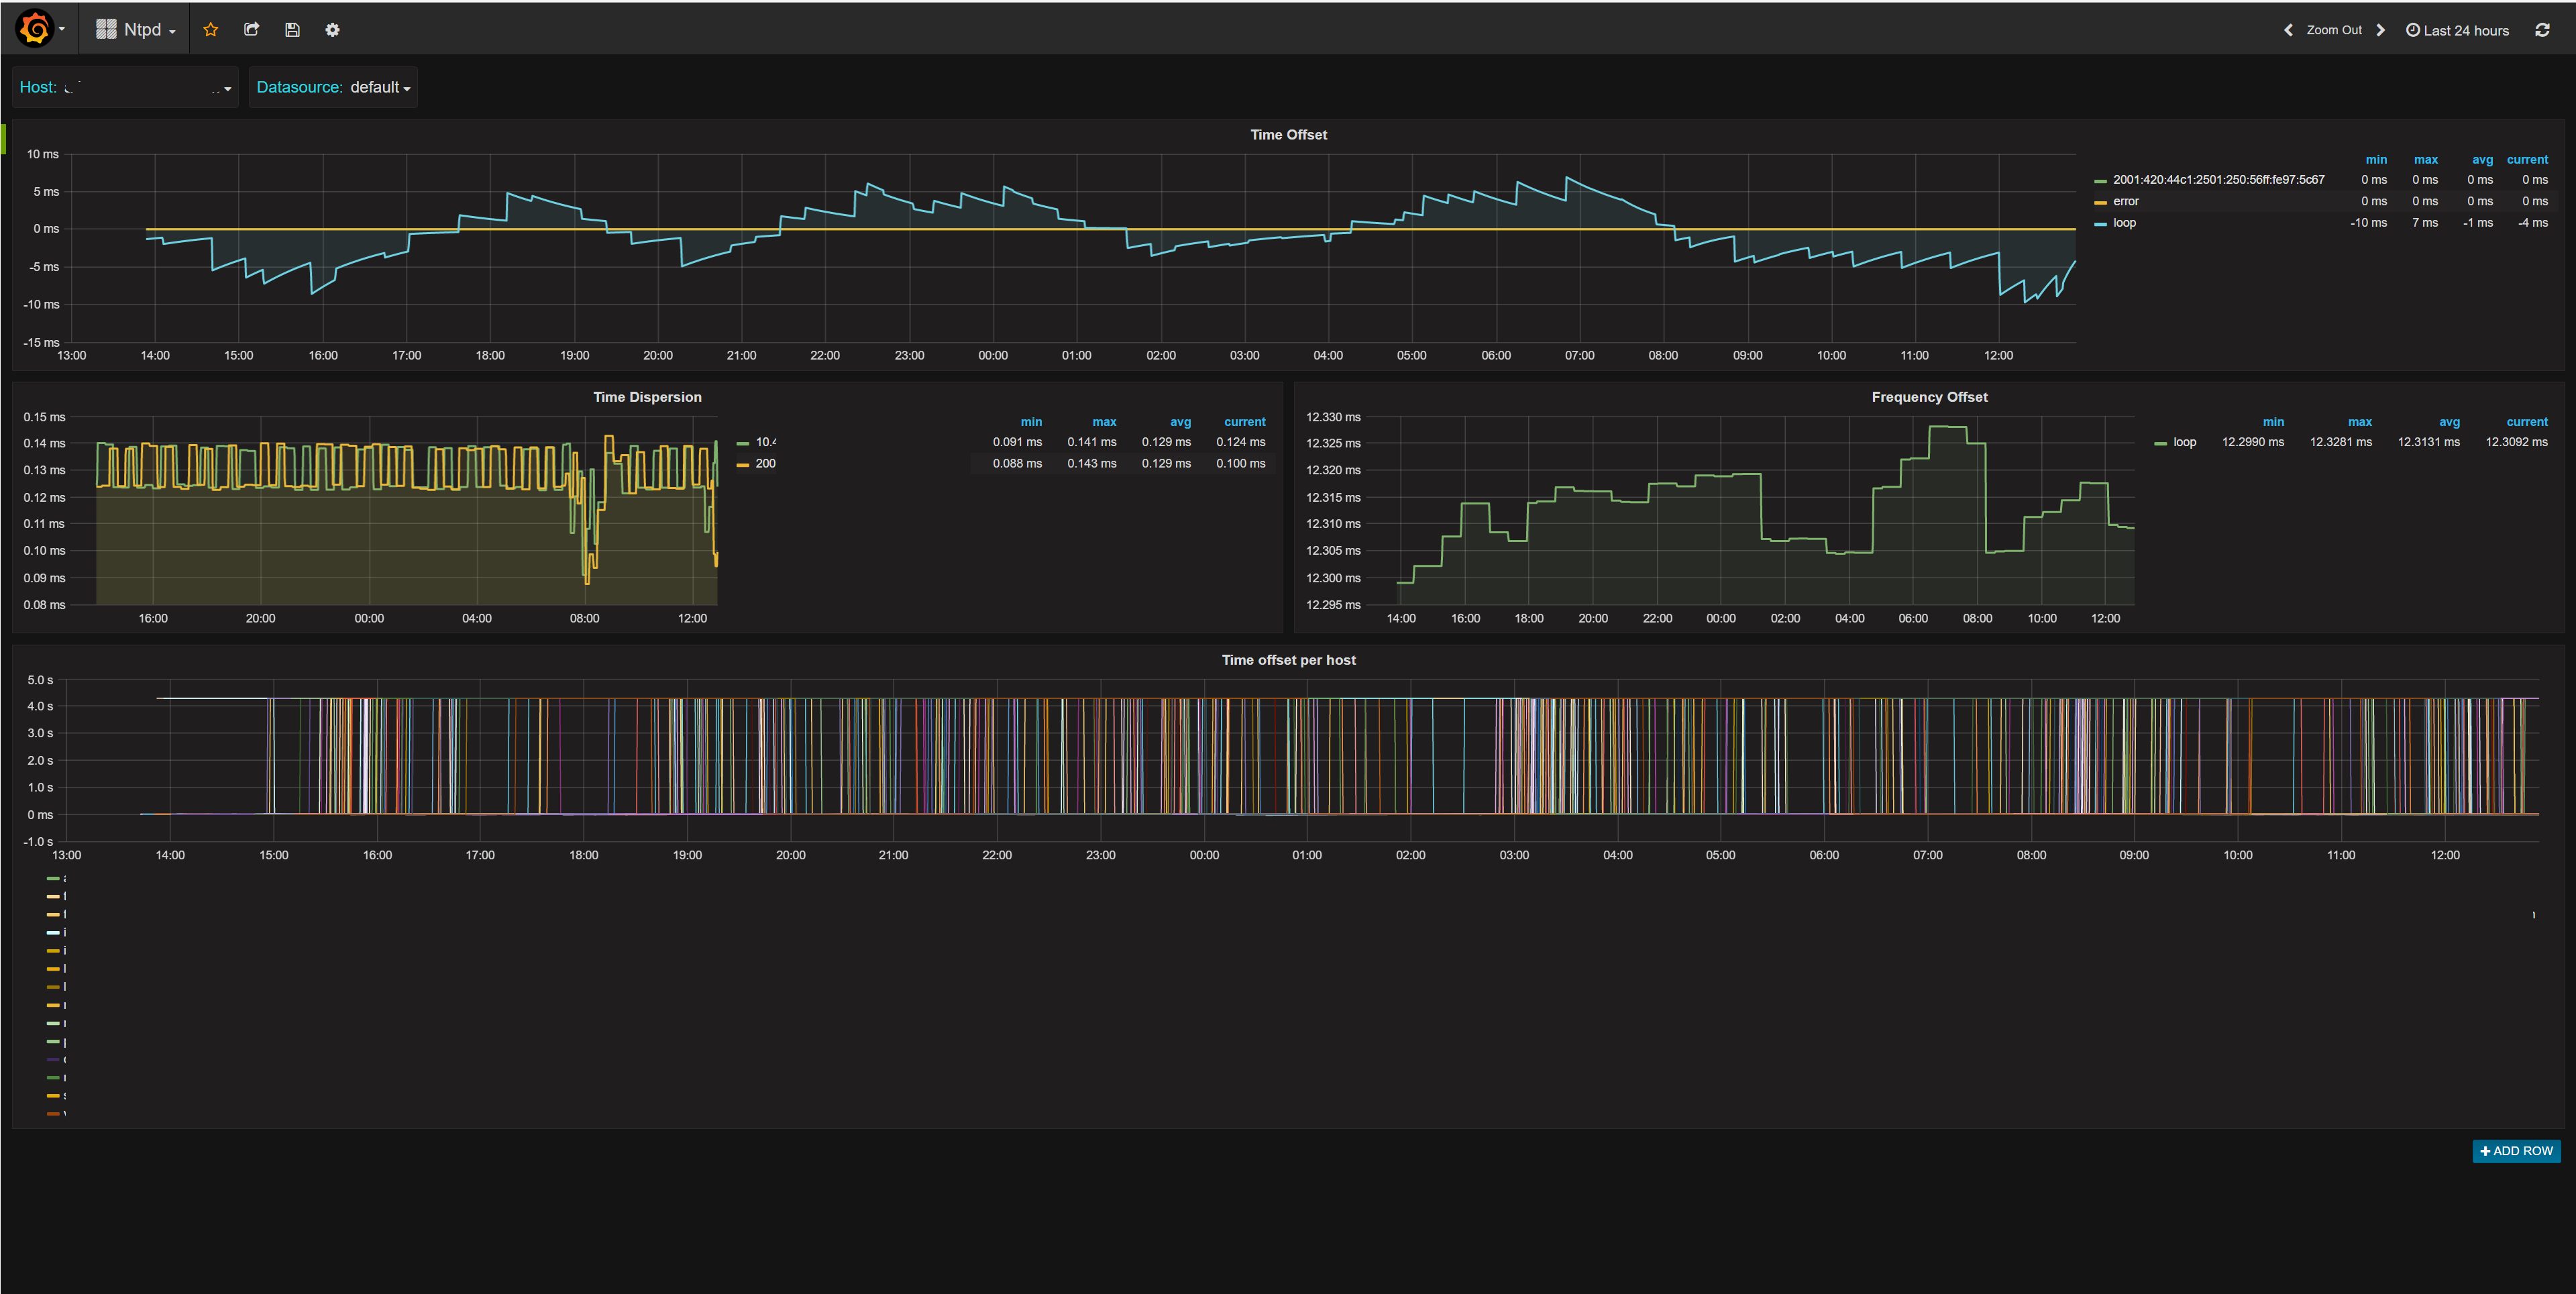
Simple dashboard to give an overview over ntpd statistics reported by CollectD ntpd plugin. Currently used to display metrics deployed by https://github.com/Yuav/puppet-monitoring which installs collectd and metrics for detected services such as ntpd by default
Data source config
Collector type:
Collector plugins:
Collector config:
Revisions
Upload an updated version of an exported dashboard.json file from Grafana
| Revision | Description | Created | |
|---|---|---|---|
| Download |