
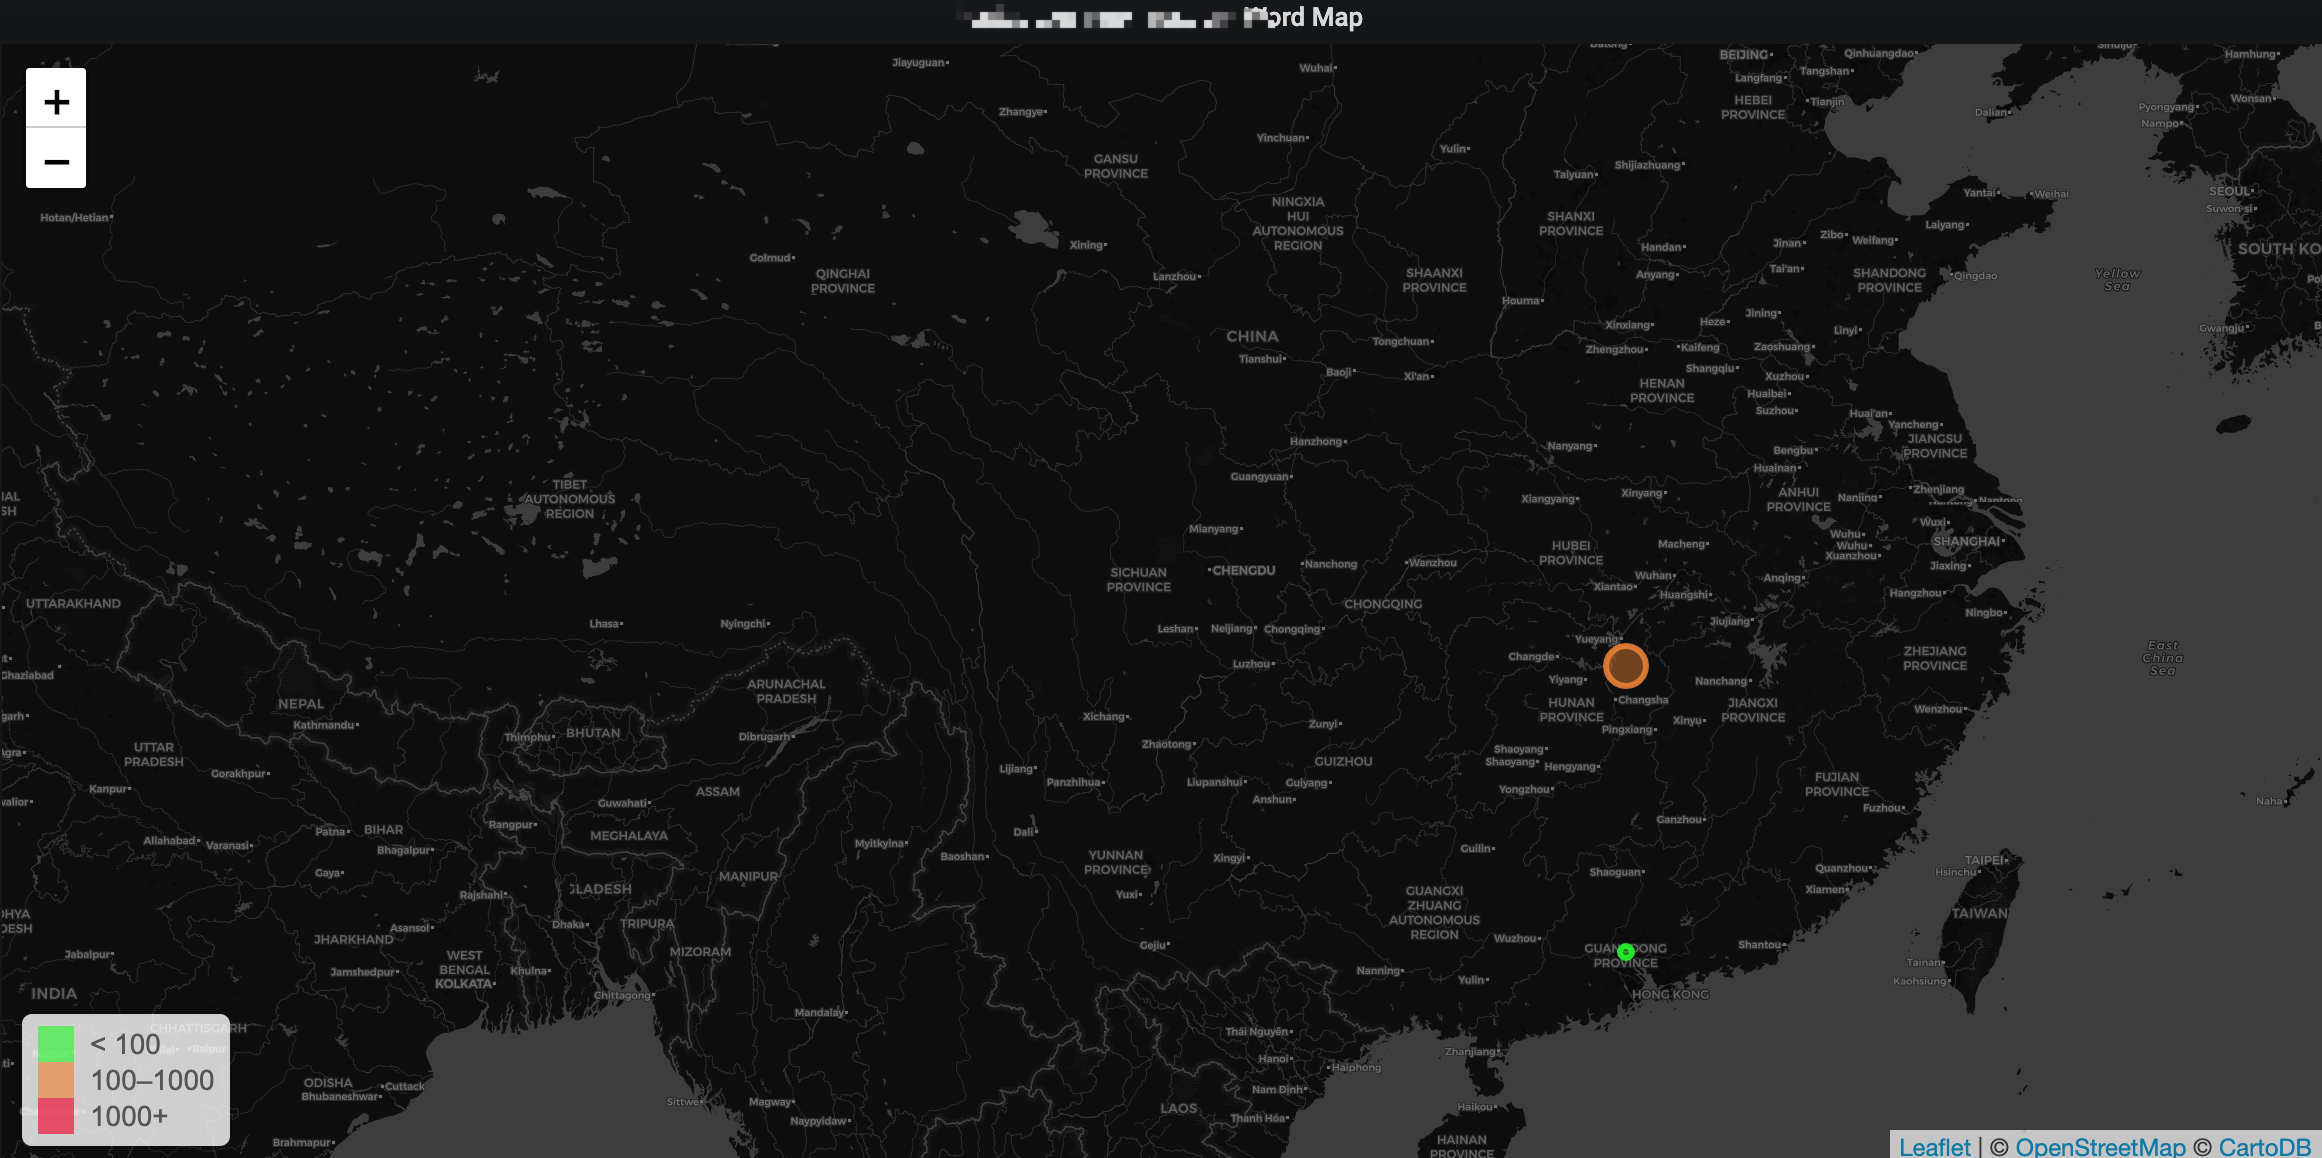
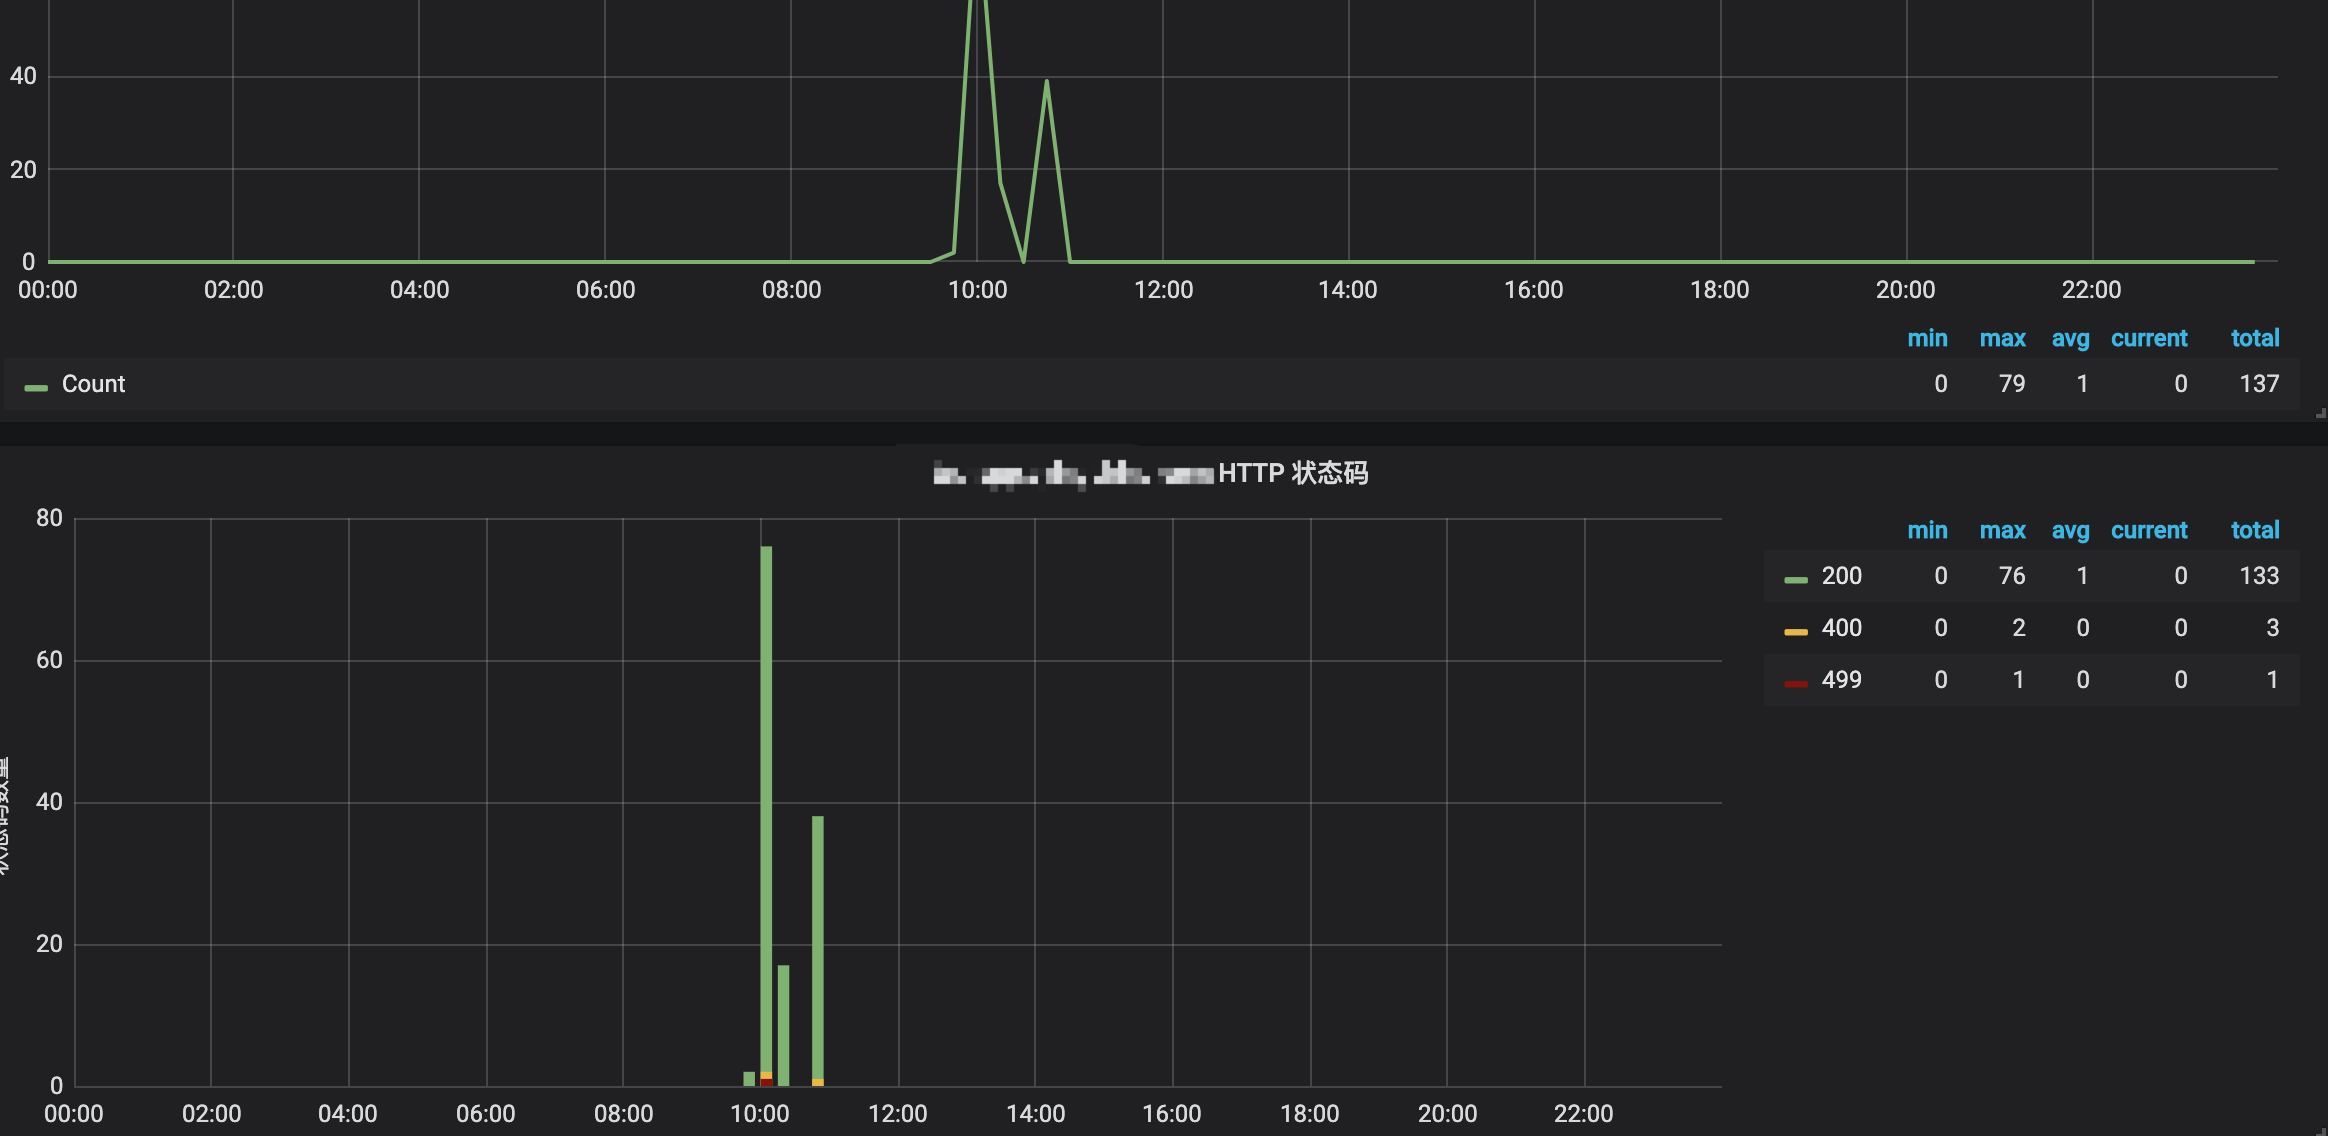
Kong http Logs
Browse, analyze logs in Elasticsearchstatus_codes, pie-chart, top 10 clientip, line-chart,word-map and etc...
tcp-log.yaml ( kong deployed in kubernets)
apiVersion: configuration.konghq.com/v1
kind: KongPlugin
metadata:
  name: tcp-log
  labels:
    global: "true"
config:
  host: logstash.logstash
  port: 1514
plugin: tcp-log
helm install logstash
values.yaml
replicaCount: 1
podDisruptionBudget:
maxUnavailable: 1
updateStrategy:
type: RollingUpdate
terminationGracePeriodSeconds: 30
image:
repository: docker.elastic.co/logstash/logstash-oss
tag: 6.7.0
pullPolicy: IfNotPresent
Add secrets manually via kubectl on kubernetes cluster and reference here
pullSecrets:
- name: "myKubernetesSecret"
service:
type: ClusterIP
clusterIP: None
nodePort:
Set this to local, to preserve client source ip. Default stripes out the source ip
externalTrafficPolicy: Local
annotations: {}
## AWS example for use with LoadBalancer service type.
# external-dns.alpha.kubernetes.io/hostname: logstash.cluster.local
# service.beta.kubernetes.io/aws-load-balancer-cross-zone-load-balancing-enabled: "true"
# service.beta.kubernetes.io/aws-load-balancer-internal: "true"
ports:
# syslog-udp:
# port: 1514
# targetPort: syslog-udp
# protocol: UDP
syslog-tcp:
port: 1514
targetPort: syslog-tcp
protocol: TCP
#beats:
# port: 5044
# targetPort: beats
# protocol: TCP
# http:
# port: 8080
# targetPort: http
# protocol: TCP
# loadBalancerIP: 10.0.0.1
ports:
- name: syslog-udp
containerPort: 1514
protocol: UDP
- name: syslog-tcp
containerPort: 1514
protocol: TCP
#- name: beats
containerPort: 5044
protocol: TCP
- name: http
containerPort: 8080
protocol: TCP
ingress:
enabled: false
annotations: {}
# kubernetes.io/ingress.class: nginx
# kubernetes.io/tls-acme: "true"
path: /
hosts:
- logstash.cluster.local
tls: []
- secretName: logstash-tls
hosts:
- logstash.cluster.local
resources: {}
We usually recommend not to specify default resources and to leave this as a conscious
choice for the user. This also increases chances charts run on environments with little
resources, such as Minikube. If you do want to specify resources, uncomment the following
lines, adjust them as necessary, and remove the curly braces after 'resources:'.
limits:
cpu: 100m
memory: 128Mi
requests:
cpu: 100m
memory: 128Mi
priorityClassName: ""
nodeSelector: {}
tolerations: []
securityContext:
fsGroup: 1000
runAsUser: 1000
affinity: {}
podAntiAffinity:
requiredDuringSchedulingIgnoredDuringExecution:
- topologyKey: "kubernetes.io/hostname"
labelSelector:
matchLabels:
release: logstash
podAnnotations: {}
iam.amazonaws.com/role: "logstash-role"
prometheus.io/scrape: "true"
prometheus.io/path: "/metrics"
prometheus.io/port: "9198"
podLabels: {}
team: "developers"
service: "logstash"
livenessProbe:
httpGet:
path: /
port: monitor
initialDelaySeconds: 20
periodSeconds: 30
timeoutSeconds: 30
failureThreshold: 6
successThreshold: 1
readinessProbe:
httpGet:
path: /
port: monitor
initialDelaySeconds: 20
periodSeconds: 30
timeoutSeconds: 30
failureThreshold: 6
successThreshold: 1
persistence:
enabled: false
logstash data Persistent Volume Storage Class
If defined, storageClassName: <storageClass>
If set to "-", storageClassName: "", which disables dynamic provisioning
If undefined (the default) or set to null, no storageClassName spec is
set, choosing the default provisioner. (gp2 on AWS, standard on
GKE, AWS & OpenStack)
storageClass: "-"
accessMode: ReadWriteOnce
size: 2Gi
volumeMounts:
- name: data
mountPath: /usr/share/logstash/data
- name: patterns
mountPath: /usr/share/logstash/patterns
- name: pipeline
mountPath: /usr/share/logstash/pipeline
volumes: []
- name: tls
secret:
secretName: logstash-tls
- name: pipeline
configMap:
name: logstash-pipeline
- name: certs
hostPath:
path: /tmp
exporter:
logstash:
enabled: true
image:
repository: bonniernews/logstash_exporter
tag: v0.1.2
pullPolicy: IfNotPresent
env: {}
resources: {}
path: /metrics
port: 9198
target:
port: 9600
path: /metrics
livenessProbe:
httpGet:
path: /metrics
port: ls-exporter
periodSeconds: 15
timeoutSeconds: 60
failureThreshold: 8
successThreshold: 1
readinessProbe:
httpGet:
path: /metrics
port: ls-exporter
periodSeconds: 15
timeoutSeconds: 60
failureThreshold: 8
successThreshold: 1
elasticsearch:
host: elasticsearch-client.efk.svc.cluster.local
port: 9200
ref: https://github.com/elastic/logstash-docker/blob/master/build/logstash/env2yaml/env2yaml.go
config:
config.reload.automatic: "true"
path.config: /usr/share/logstash/pipeline
path.data: /usr/share/logstash/data
ref: https://www.elastic.co/guide/en/logstash/current/persistent-queues.html
queue.checkpoint.writes: 1
queue.drain: "true"
queue.max_bytes: 1gb # disk capacity must be greater than the value of queue.max_bytes
queue.type: persisted
Patterns for filters.
Each YAML heredoc will become a separate pattern file.
patterns:
main: |-
TESTING {"foo":.*}$
NOTE: To achieve multiple pipelines with this chart, current best practice
is to maintain one pipeline per chart release. In this way configuration is
simplified and pipelines are more isolated from one another.
inputs:
main: |-
input {
# udp {
# port => 1514
# type => syslog
# }
tcp {
port => 1514
type => syslog
codec => json
}
#beats {
# port => 5044
#}
# http {
# port => 8080
# }
# kafka {
# ## ref: https://www.elastic.co/guide/en/logstash/current/plugins-inputs-kafka.html
# bootstrap_servers => "kafka-input:9092"
# codec => json { charset => "UTF-8" }
# consumer_threads => 1
# topics => ["source"]
# type => "example"
# }
}
filters:
main: |-
filter {
geoip {
source => "client_ip"
}
}
outputs:
main: |-
output {
stdout { codec => rubydebug }
elasticsearch {
hosts => ["${ELASTICSEARCH_HOST}:${ELASTICSEARCH_PORT}"]
manage_template => true
index => "logstash-kong-http-log-%{+YYYY.MM.dd}"
}
# kafka {
# ## ref: https://www.elastic.co/guide/en/logstash/current/plugins-outputs-kafka.html
# bootstrap_servers => "kafka-output:9092"
# codec => json { charset => "UTF-8" }
# compression_type => "lz4"
# topic_id => "destination"
# }
}
helm install elasticsearch
pass
Data source config
Collector config:
Upload an updated version of an exported dashboard.json file from Grafana
| Revision | Description | Created | |
|---|---|---|---|
| Download |
Apache HTTP Server
Easily monitor Apache HTTP Server, an open source HTTP server for modern operating systems including UNIX and Windows, with Grafana Cloud's out-of-the-box monitoring solution.
Learn more