PostgreSQL Queries Overview (Designed for PMM)
PostgreSQL Queries Overview Dashboard
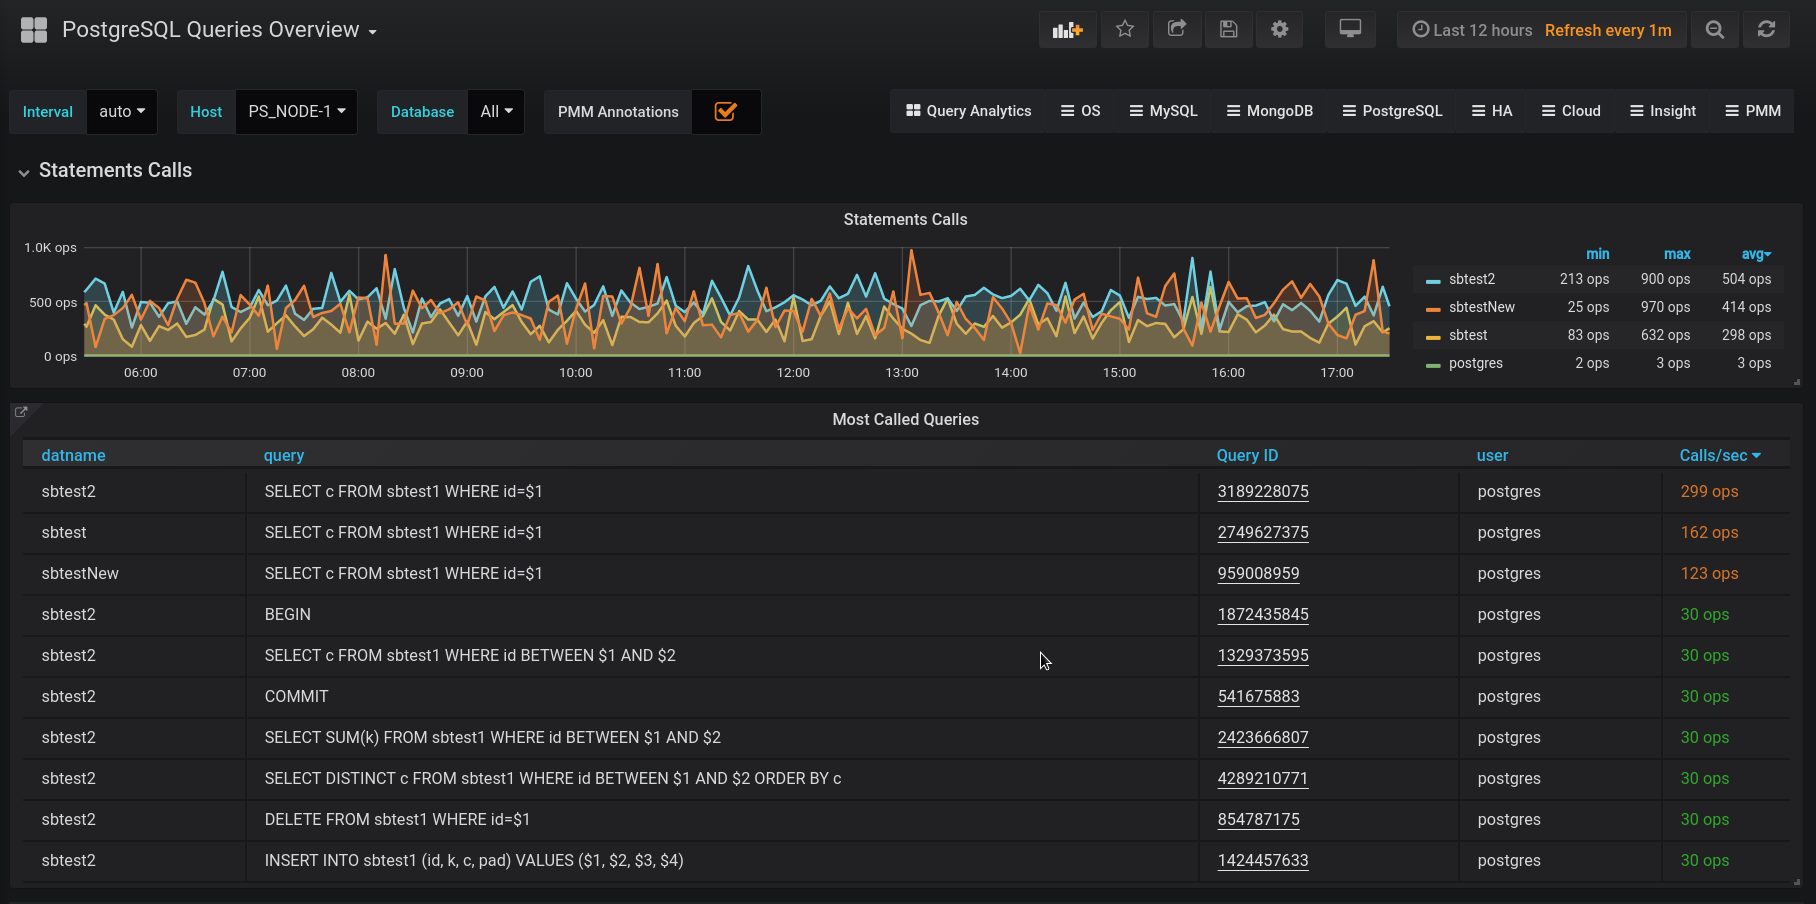
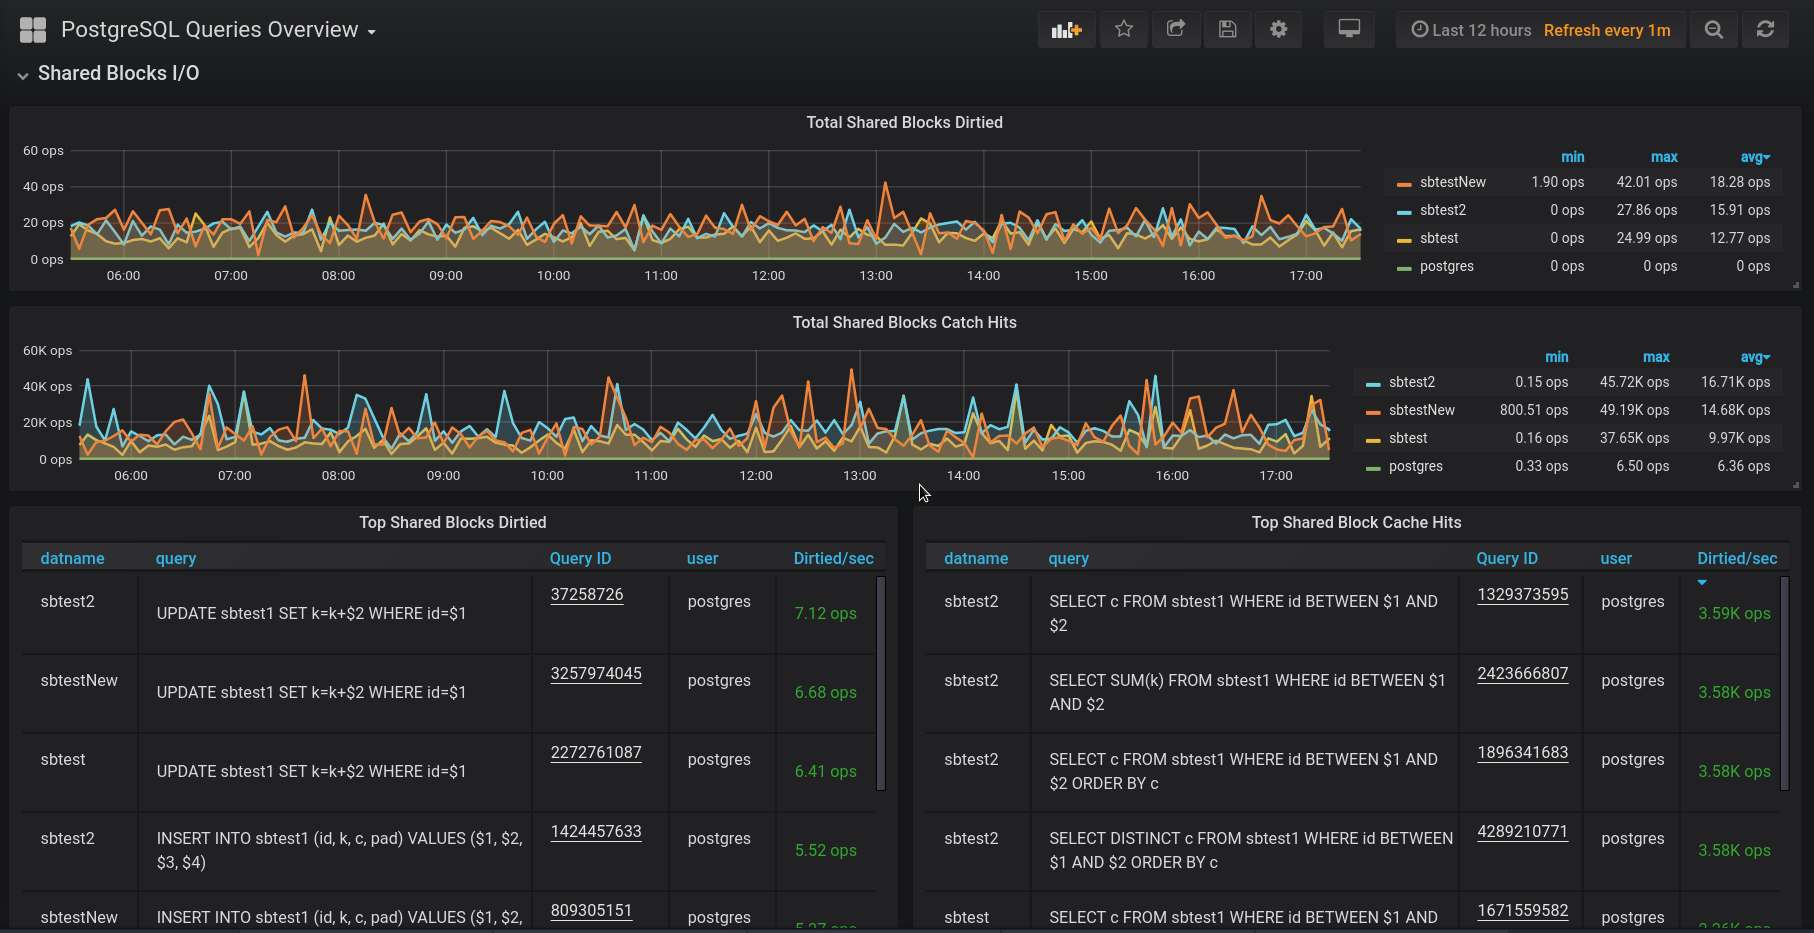
Following on the heels of our PostgreSQL Tuples Statistics Dashboard, here's another blog post describing how you can gain additional visibility of PostgreSQL queries using PMM. We take a look at using an extension called pg_stat_statements. This allows us to collect information about the various queries running in your PostgreSQL instance. We'll describe how to check if you already have pg_stat_statements running, and if not how to enable the extension in PostgreSQL. Finally, we'll see how to enable collection using a custom query file and pmm-admin option flag.
Read more - https://www.percona.com/blog/2019/04/23/adding-postgresql-queries-overview-dashboards-to-the-pmm-plugin/
Data source config
Collector config:
Upload an updated version of an exported dashboard.json file from Grafana
| Revision | Description | Created | |
|---|---|---|---|
| Download |
PostgreSQL
Easily monitor your deployment of PostgreSQL, the open source relational database, with Grafana Cloud's out-of-the-box monitoring solution.
Learn more

