Postfix
Prometheus Postfix exporter metrics.
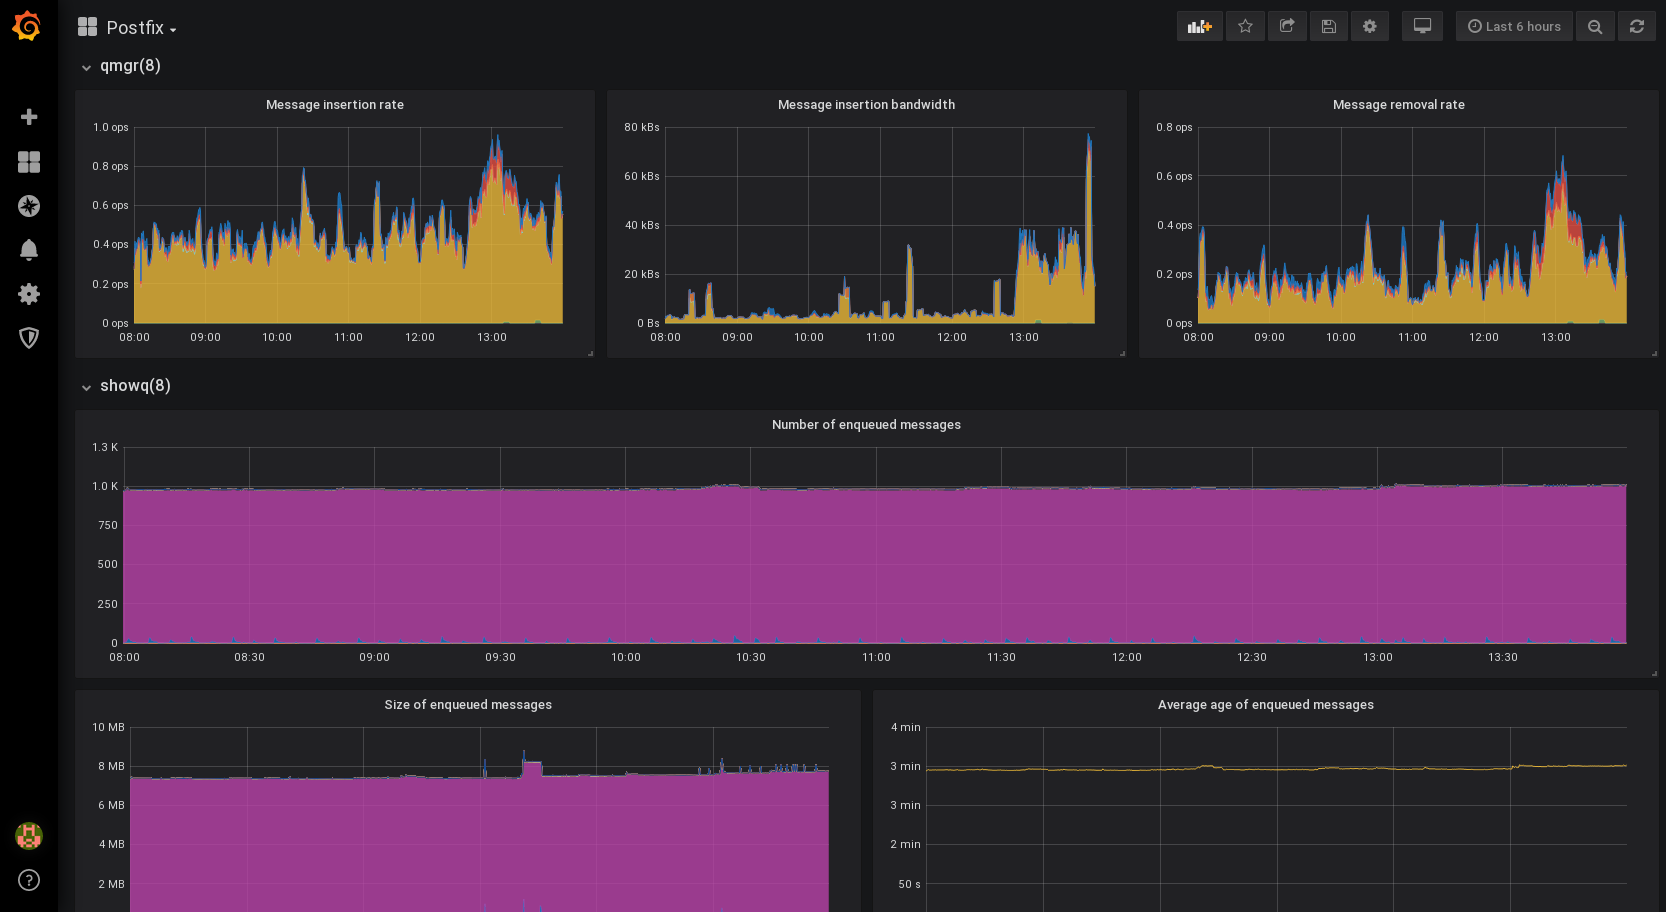
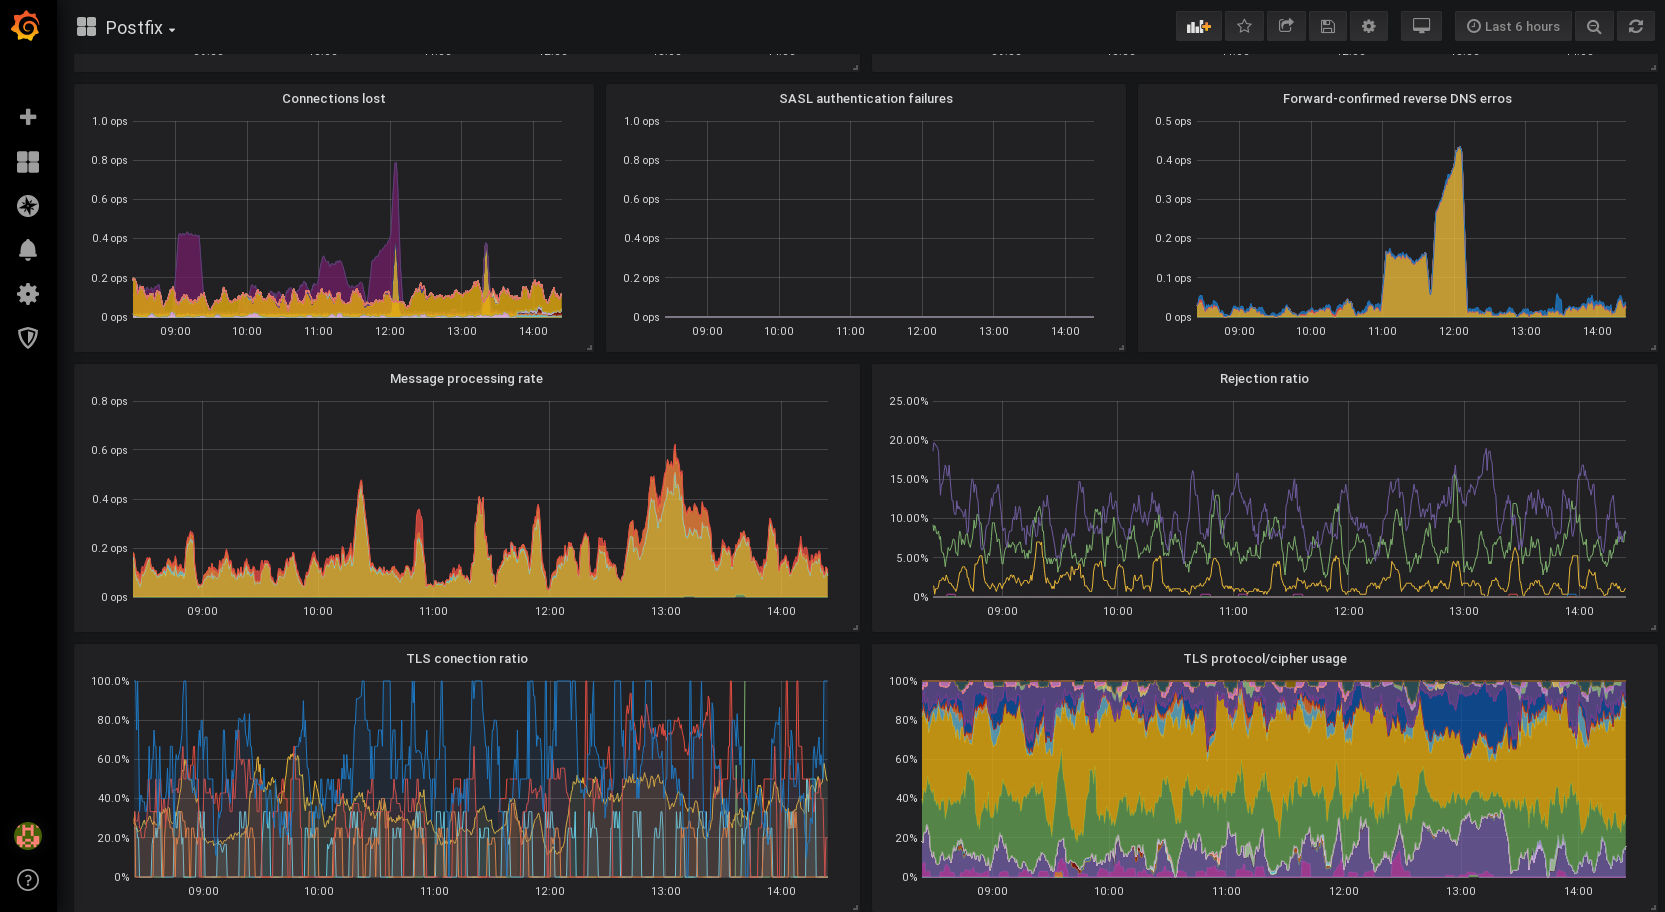
This dashboard parses data from the Prometheus Postfix exporter and renders it in various graphics. Data can be aggregated across all mailservers or on a subset. Supports per-daemon message processing rate, queue message counts and sizes, delivery duration, rejection rates and TLS cipher usage.
Originally written by @BartVerc by adapted to normal exporter metrics by @anarcat.
DEPRECATION NOTICE: I do not actually use this dashboard anymore as there are significant issues with the postfix exporter. Instead I use a mtail-based approach, see this page for details: https://gitlab.torproject.org/tpo/tpa/grafana-dashboards
Data source config
Collector type:
Collector plugins:
Collector config:
Revisions
Upload an updated version of an exported dashboard.json file from Grafana
| Revision | Description | Created | |
|---|---|---|---|
| Download |