Grafana logo

Dashboard anything. Observe everything.

Query, visualize, alert on, and understand your data no matter where it’s stored. With Grafana you can create, explore, and share all of your data through beautiful, flexible dashboards.

video icon
ビデオ
Grafana LGTMスタックの始め方
このウェビナーでは、LGTMスタックの使い方をデモでご紹介します:Loki(ログ管理)、Grafana(可視化)、Tempo(トレース管理)、Mimir(メトリクス管理)
video icon
ビデオ
Grafana LGTMスタックの始め方
このウェビナーでは、LGTMスタックの使い方をデモでご紹介します:Loki(ログ管理)、Grafana(可視化)、Tempo(トレース管理)、Mimir(メトリクス管理)
link icon
Grafana オープンなオブザーバビリティ・プラットフォーム
Grafana: オープンなオブザーバビリティ・プラットフォーム
Grafanaは、あらゆるデータベースのためのオープンソースの分析&監視ソリューションです。
blog post icon
ブログ投稿
Azure Data ExplorerとGrafana Cloudを使用してFormula 1リアルタイム分析スタックを構築する方法
Formula 1において、スピードとはトラックをどれだけ速く走れるかだけではありません。レースの前、最中、そして後に重要な改善を行うために、リアルタイムでデータを手に入れることも重要です。 …
blog post icon
ブログ投稿
ParadigmがGrafana Cloudに移行した理由:彼らのオブザーバビリティスタックの裏側
暗号通貨における最大の流動性ネットワークとして、Paradigm は毎月110億ドル以上の取引量を促進し、世界の暗号通貨オプション取引の約40%を占めています。同社の無料プラットフォームは、複数の資産 …
blog post icon
ブログ投稿
Ultimate社がGrafana IRMを活用して、ワークフロー、利用率などを改善した方法
AI駆動のカスタマーサポート自動化プラットフォームを運営するUltimate社が、なぜIRMのためにGrafana Cloudに移行したのか、そしてその取り組みがどのようにしてGrafana OnCallへの関心から始まったのかについて学びましょう。
blog post icon
ブログ投稿
Grafana Cloudでのログ管理:4人のオブザーバビリティ専門家がOSSからGrafana Cloud Logsへの移行について語る
OSSと完全管理型ソリューションのどちらでログ管理を行うか迷っていますか?ここでは、オブザーバビリティの専門家が最終的にGrafana Cloudを選んだ理由を紹介します。
blog post icon
ブログ投稿
TeleTrackingがGrafana Cloudを使ってより優れたオブザーバビリティプラットフォームを構築するための旅の全貌
TeleTrackingがどのようにPrometheusとGrafana Cloudを組み合わせて、ユーザーにより大きなサービスの可視性を提供し、オーバーヘッドを削減し、常に進化する開発者体験の重要なフィードバックメカニズムとして機能させたかをご覧ください。
blog post icon
ブログ投稿
企業がメトリクス管理のためにOSSからGrafana Cloudへ移行する理由
コスト最適化から信頼性の向上まで、企業がメトリクスデータの管理と監視のためにGrafana Cloudへ移行する主な理由を以下に示します。
blog post icon
ブログ投稿
Grafana Labs、日本でのオープンソースオブザーバビリティコミュニティを拡大
日本のOSSコミュニティも、より大きなGrafanaコミュニティの重要な一部であり、ミートアップの開催、新しいデータソースの開発、さらには月面着陸の実現に貢献しています。
blog post icon
ブログ投稿
ObservabilityCON on the Roadが東京にやってくる!
ObservabilityCON on the Roadが初めて日本にやってきます!2025年2月25日、東京ポートシティ竹芝のポートホールで開催される一日限りのイベントにぜひご参加ください。
docs icon
Grafanaドキュメント
Grafanaドキュメント
ガイド、インストール方法、および機能に関するドキュメント
docs icon
Grafanaのインストール
Grafanaのインストール
Grafanaのインストールガイド
docs icon
Grafana loki
Grafana Loki
Grafana Lokiは、フル機能のログスタックを構成することができるオープンソースのコンポーネント群です。
info icon
Info
Lokiの概要
Lokiの製品概要と機能
link icon
Grafanaを入手
Grafanaを入手
今すぐGrafanaインスタンスをダウンロードまたは起動しましょう。
link icon
Grafanas
Grafanas
link icon
Grafanaダッシュボード
Grafanaダッシュボード
公式およびコミュニティが作成したダッシュボードのライブラリを閲覧できます。
link icon
Grafanaダッシュボード
Node Exporter Full
Prometheusのノードエクスポーターでエクスポートされたほぼすべてのデフォルト値がグラフ化されます。 必要なのはデフォルトのjob_name: nodeのみで、必要なだけター …
product icon
製品
料金
Grafanaのコストを知りたいですか?Grafana、Prometheus / Mimir(メトリクス)、Loki(ログ)、Tempo(トレース)などの価格について知ることができます。
product icon
製品
Grafana Cloud
Grafana、Mimir、Loki、Tempoのオープンソースプロジェクトで構築されたフルマネージドクラウドオブザーバビリティ・プラットフォーム。無料トライアルを開始する。
product icon
製品
Grafana Alerting
Grafana Alertingは、問題を迅速に特定し解決するための強力で実用的なアラートを提供します。
product icon
製品
Grafana Cloud Application Observability
OpenTelemetryとPrometheusのネイティブサポートを持つGrafana Cloudアプリケーションオブザーバビリティは、アプリケーションのモニタリングとMTTR(平均修復時間)の最小化を目指す、すぐに使えるソリューションを提供し、ベンダーロックインを避けます。
product icon
製品
Grafana CloudのFrontend Observabilityを始める
Grafana Cloud Frontend Observabilityは、リアルユーザーモニタリング(RUM)を通じて、Webアプリケーションのエンドユーザー体験について、即時かつ明確で実用的なインサイトを提供します。
product icon
製品
Grafana Cloud Logs
Grafana Cloud Logsは、ログボリューム、コスト、またはストレージの制限を心配することなく、すべてのアプリケーションとインフラストラクチャからのログを保存し、照会することを可能にする完全に管理されたログアグリゲーションシステムです。
product icon
製品
Grafana Incident
Grafana Incidentは、メンバーがインシデントのタイムラインにメモ、URL、さらにはGrafanaのグラフを追加できるようにすることで、コラボレーションを改善し、事後分析を同時に充実させることができます。この機能により、チームはインシデントのコンテキストをより深く理解し、解決策をより迅速に共有することが可能になります。
product icon
製品
Grafana Cloud IRM
GrafanaのIncident Response & Managementツールは、最小限の労力でインシデントを検出し、対応し、そこから学ぶことを容易にします。
product icon
製品
Grafana Cloud k6
Grafana Cloud k6を使用すると、最大100万人の同時仮想ユーザーまたは秒間500万リクエストのクラウドベースのパフォーマンステストを簡単に実行できます。
product icon
製品
Grafana Cloud Logs
Grafana Cloud Logsは、ログボリューム、コスト、またはストレージの制限を心配することなく、すべてのアプリケーションとインフラストラクチャからのログを保存し、照会することを可能にする完全に管理されたログアグリゲーションシステムです。
product icon
製品
Grafana Cloud Metrics
オープンソースプロジェクトGrafana Mimirとクラウドオブザーバビリティ・プラットフォームGrafana Cloudで、すべてのメトリクスデータの監視をあらゆる規模で実現します。
product icon
製品
Adaptive Metrics
Prometheus メトリクスを使用する場合のみ支払いが発生します。保存される時系列データを最大50%削減できます。セットアップやダッシュボードを変更する必要はありません。Grafana Cloud Adaptive Metricsへようこそ。
product icon
製品
Grafana OnCall
Grafana OnCallは、開発者向けに特別に設計されたシンプルなワークフローとインターフェースを通じて、オンコール管理の手間を軽減する使いやすいオンコール管理ツールです。
product icon
製品
Grafana Cloud Profiles
Grafana Cloud Profilesを使用して、スタックに簡単に継続的プロファイリングを追加しましょう。これはホスティングされたツールで、アプリケーションのパフォーマンスに関するリソース使用と遅延の洞察を提供します。
product icon
製品
Grafana SLO
Grafana Cloud内でサービスレベル目標(SLO)、SLOダッシュボード、およびエラーバジェットアラートを作成、管理、スケールすることができます。
product icon
製品
Grafana Cloud Synthetic Monitoring
Grafana Cloud Synthetic Monitoringは、ユーザーの行動をシミュレートし、サーバー側のコードインストルメンテーションなしで、プロダクションにおける重要なワークフローを定期的にチェックします。
product icon
製品
Grafana Cloud Traces
Grafana Cloudの分散トレーシングシステムは、システム全体の健全性を理解し、問題を素早く追跡することを可能にします。OpenTelemetry、Jaeger、Zipkinトレースフォーマットと完全な互換性があります。
success icon
サクセスストーリー
Grafana CloudでMTTRを削減:ASOSのオブザーバビリティスタックの裏側
オンライン小売業者のASOSが、リアルタイムのオブザーバビリティを実現するためにGrafana CloudとGrafana SLOに依存し、シームレスな顧客体験を確保している方法を読んでください。
success icon
サクセスストーリー
ExabeamがGrafana Cloudで2,000万のアクティブタイムシリーズのインサイトと管理を得た方法
レガシーのプロプライエタリソリューションからGrafana Cloudに移行することで、Exabeamのオブザーバビリティプラットフォームがどのようにスケールし、コストを削減し、開発者の体験を改善したかを学びましょう。
success icon
サクセスストーリー
Grafana Cloud Logs:Lithicのより良いオブザーバビリティへのゲートウェイ
Lithicがゼロダウンタイムを追求する中で、なぜ彼らが現代のオブザーバビリティスタックを支えるためにGrafana Cloud Logsを選んだのかをご覧ください。
success icon
サクセスストーリー
数分でメトリクスのボリュームを削減:SailPointがGrafana Cloudでカーディナリティとコストを管理する方法
SailPointがGrafana CloudとAdaptive Metricsを使用することで、メトリクスのボリュームを33%削減し、コントロール、効率、コスト削減を数分で実現しました。
必要な日本語コンテンツが見つからない場合は、翻訳されたサマリーを利用ください。

必要な日本語コンテンツが見つからない場合は、翻訳されたサマリーを利用ください。

任意のページでこのマーク を探し、日本語を選択すると、そのページの要約が日本語で表示されます。


Why Grafana?

Unify your data, not your database

Grafana doesn’t require you to ingest data to a backend store or vendor database. Instead, Grafana takes a unique approach to providing a “single-pane-of-glass” by unifying your existing data, wherever it lives.

With Grafana, you can take any of your existing data- be it from your Kubernetes cluster, raspberry pi, different cloud services, or even Google Sheets- and visualize it however you want, all from a single dashboard.

Come together… right now… over me (sing it).

Data everyone can see

Grafana was built on the principle that data should be accessible to everyone in your organization, not just the single Ops person.

By democratizing data, Grafana helps to facilitate a culture where data can easily be used and accessed by the people that need it, helping to break down data silos and empower teams.

Of course, sometimes you don’t want Eric in Accounting to see everything, Grafana Cloud and Enterprise editions offer extensive security options.

Dashboards that anyone can use

Not only do Grafana dashboards give insightful meaning to data collected from numerous sources, but you can also share the dashboards you create with other team members, allowing you to explore the data together.

With Grafana, anyone can create and share dynamic dashboards to foster collaboration and transparency.

We don’t really mean anyone, especially that guy that talks about how much better it was when we had fax machines.

Flexibility and versatility

Translate and transform any of your data into flexible and versatile dashboards. Unlike other tools, Grafana allows you to build dashboards specifically for you and your team.

With advanced querying and transformation capabilities, you can customize your panels to create visualizations that are actually helpful for you.

We think you’re great the way you are, but who couldn’t be a bit more flexible?

“When you become a big business with all this data, you need to pull it together. And I think Grafana is the gel that pulls everything together from across the business to give us a real-time snapshot of how Utilita’s doing at any given moment. It’s incredibly valuable.”
Adrian Goater
Web Development Manager, Utilita
“We can audit our data to see which metrics have the highest cardinality, or to see which services are publishing the most metric series. This gives us an opportunity to know where to filter out metrics for the highest impact.”
Jake Utley
Senior Software Engineer, Hiya
“We not only track traditional technical and engineering metrics in Grafana. We also present much-needed operational data that various business teams use to get a pulse on the day-to-day health of the business.”
Carl Johnson
Director of Infrastructure and SRE, The Trade Desk
“It’s sort of like all signal, no noise. You call Grafana up and it just shows you what you want, which is really nice.”
Matt Menzenski
Software Engineering Manager, PayIt

Choose the version of Grafana that’s best for you

Get Grafana fully managed with Grafana Cloud or run on your own infrastructure with self-managed options.

Cloud Free

No payment. Ever.
Best suited for early stage and small teams with up to 3 active users per month.
Easiest way to get started

Cloud Pro

Pay as you go
Best suited for growing teams that need to scale above 3 active users and unlock 8x5 support.

Cloud Advanced

Premium bundle
Best suited for teams looking to connect to Enterprise plugins and unlock 24x7 support.

Let the data tell your story

Grafana provides powerful and elegant ways to extract and share insights
Kubernetes capacity
Home energy
Website performance
Team sprints
Revenue

Correlate your data

Understanding all relevant data — and the relationships between them — is important for root-causing incidents as quickly as possible and identifying the real source of unexpected system behavior. Grafana allows teams to seamlessly visualize and move among all of their data, all in one place.


Grafana key features

Panels

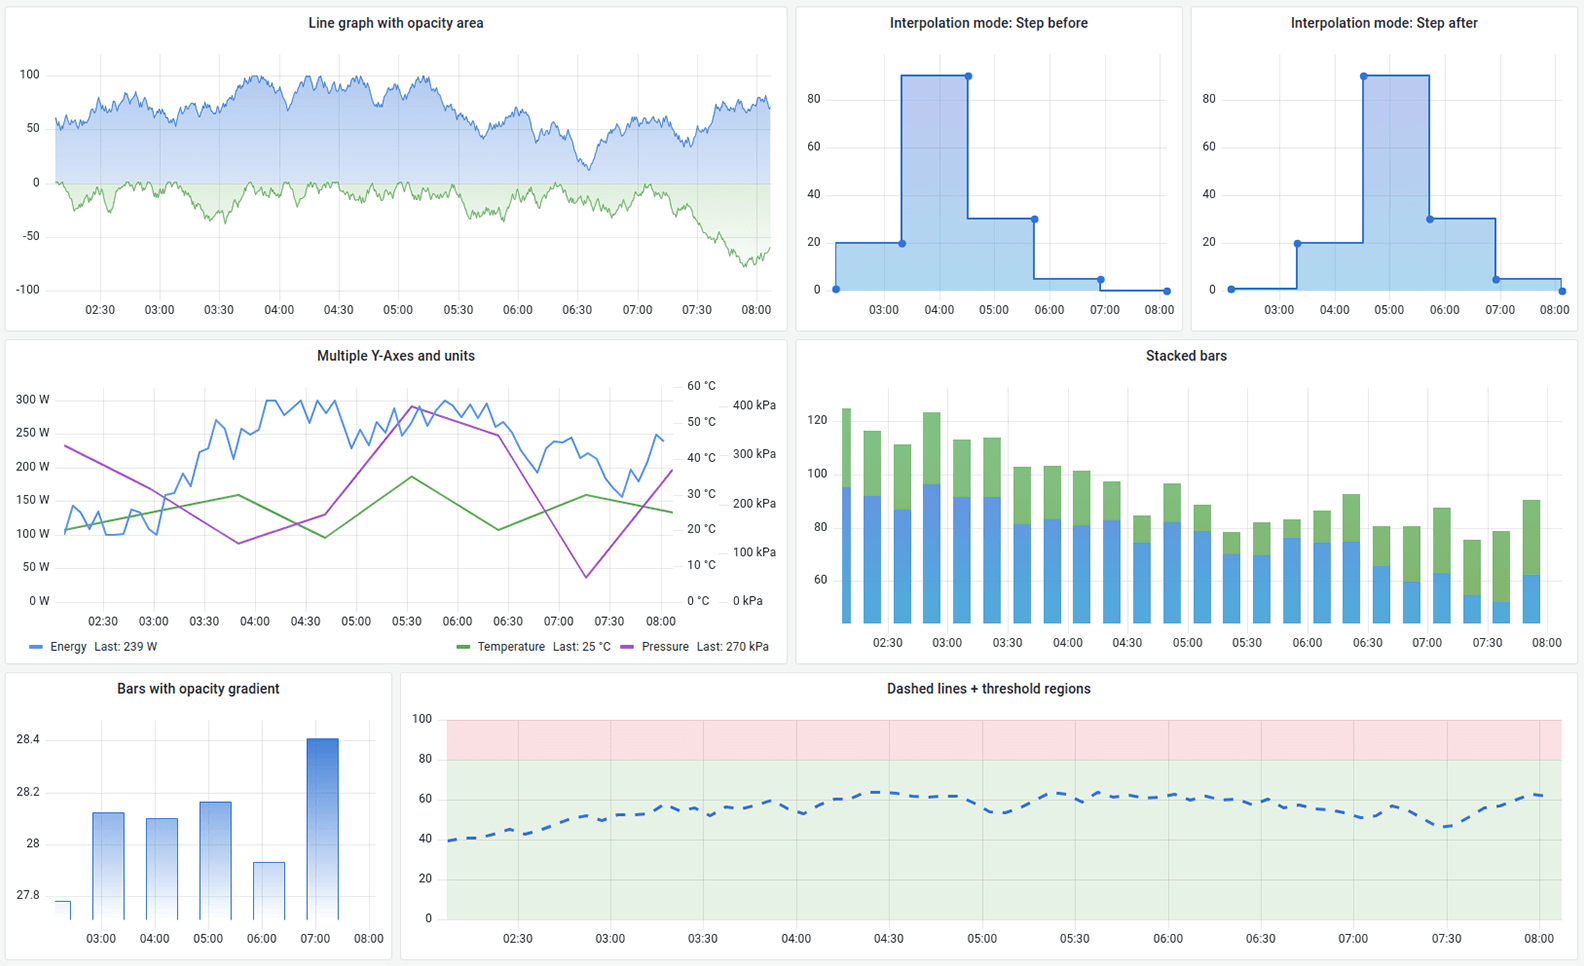
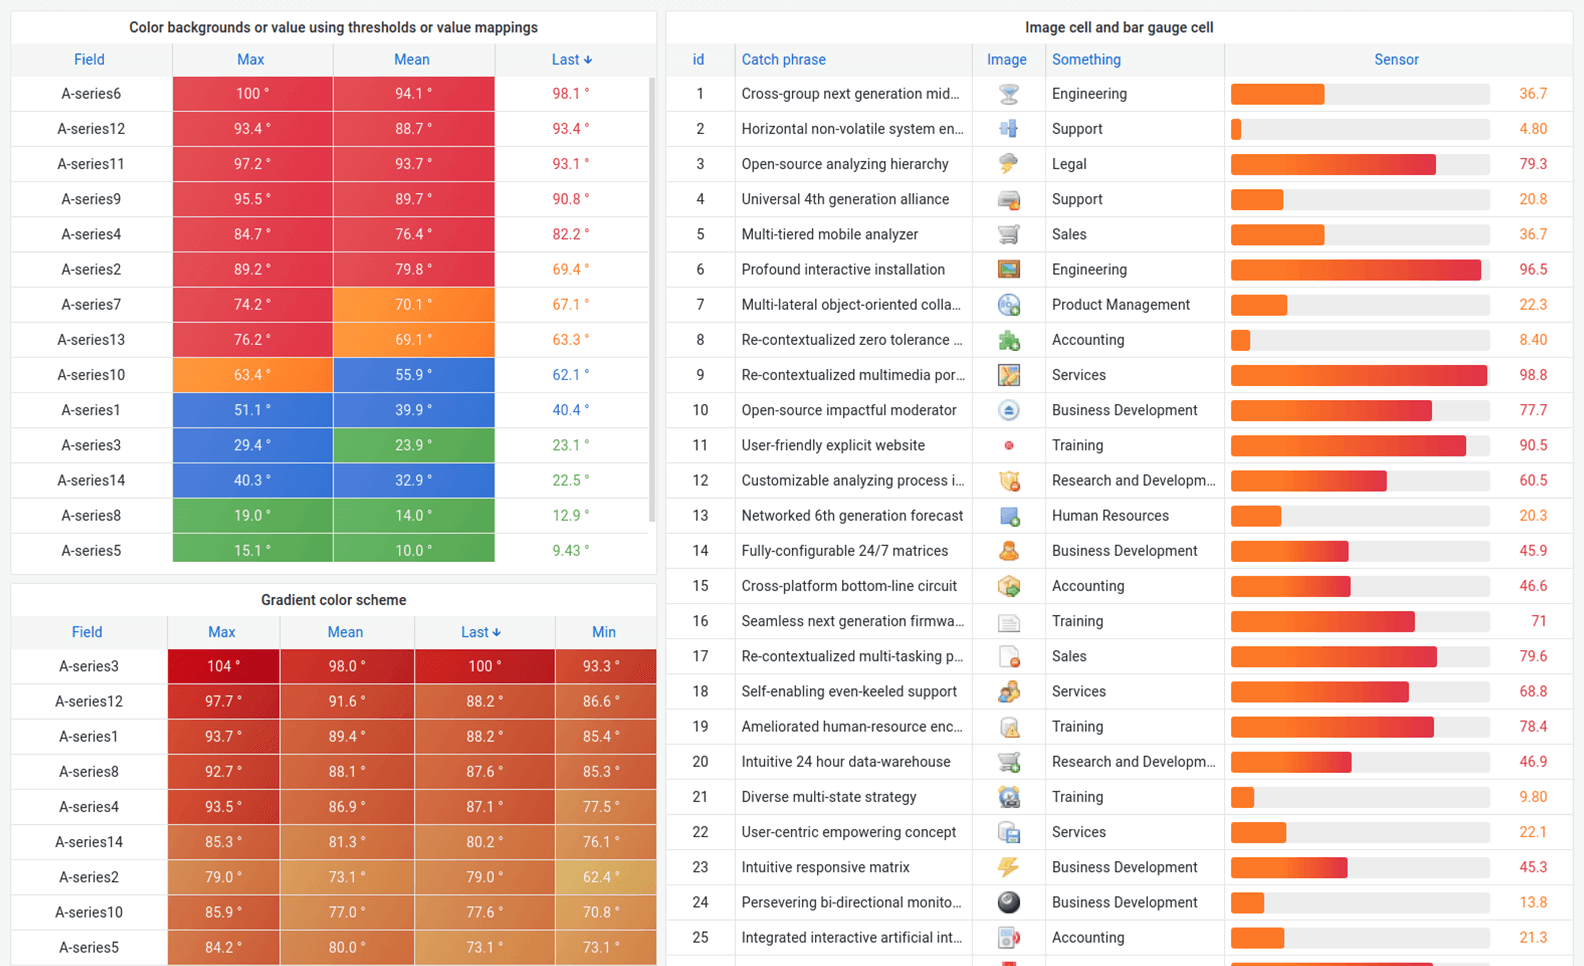
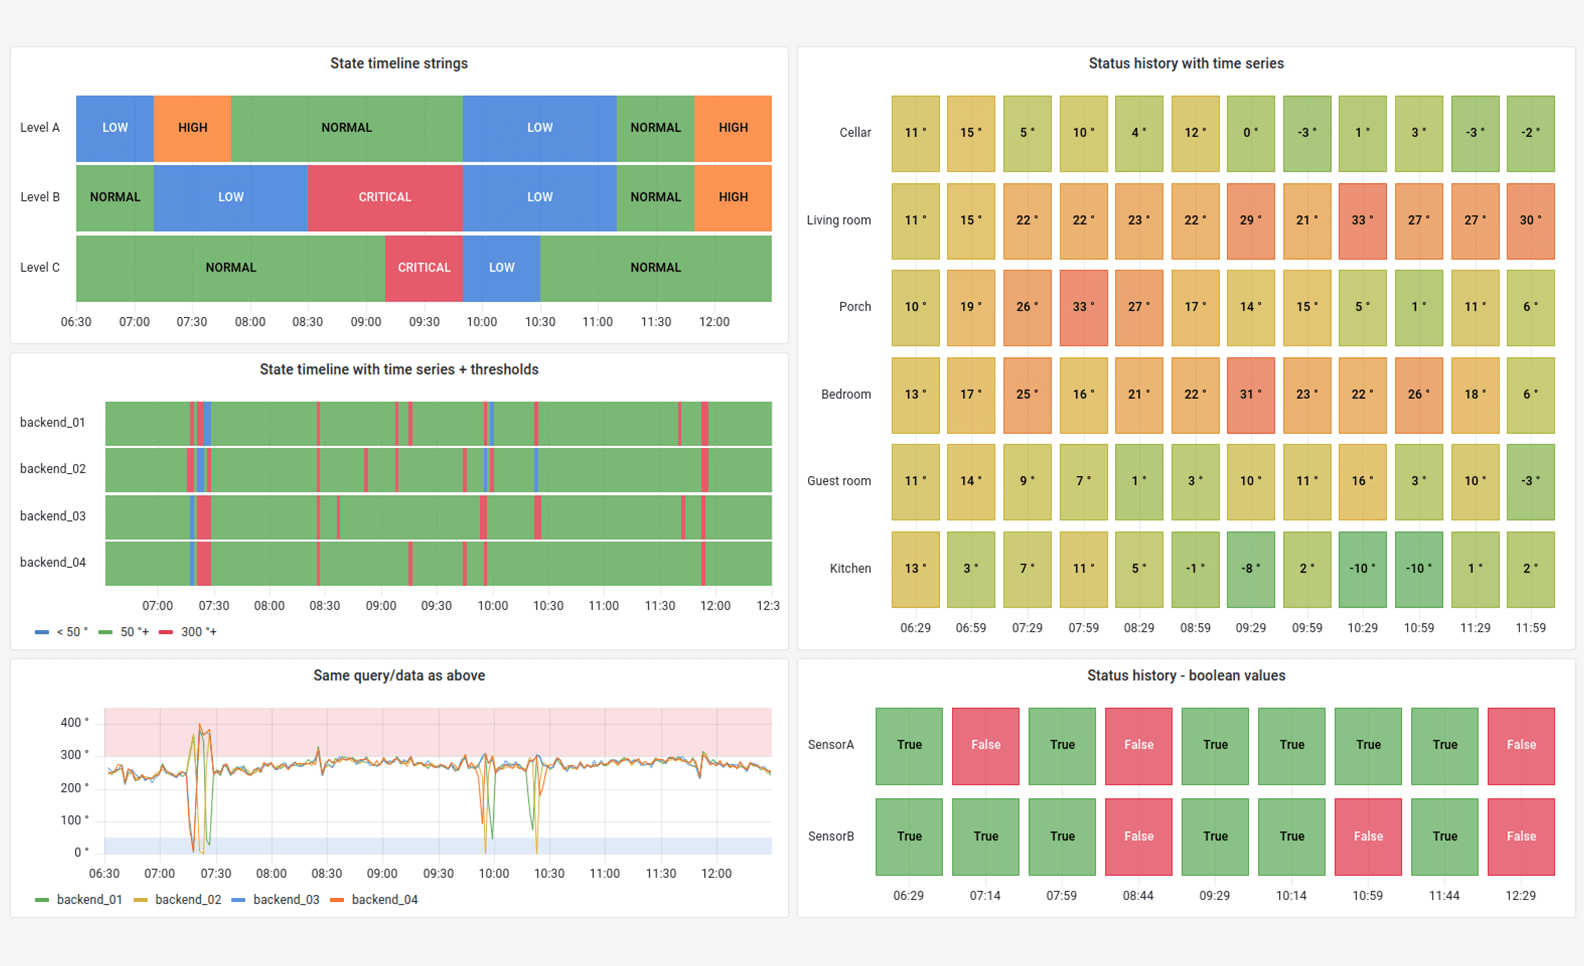
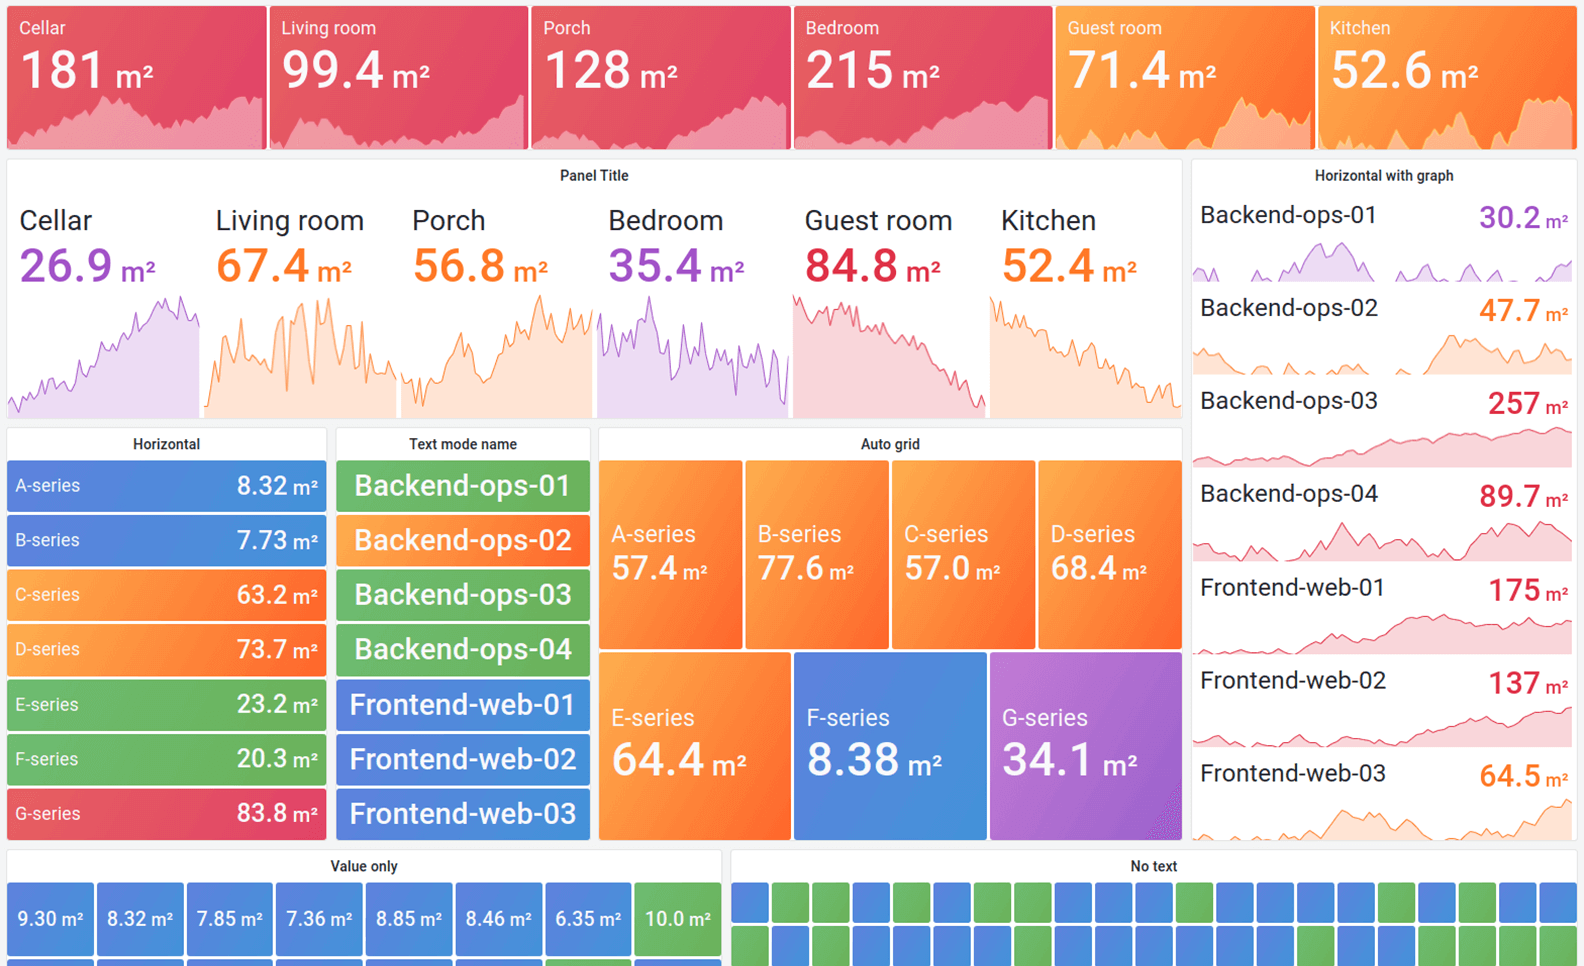
From heatmaps to histograms. Graphs to geomaps. Grafana has fast and flexible visualizations that allows you to visualize your data, any way you want.
Time series
Time series
Tables
Tables
State timeline
State timeline
Stat
Stat
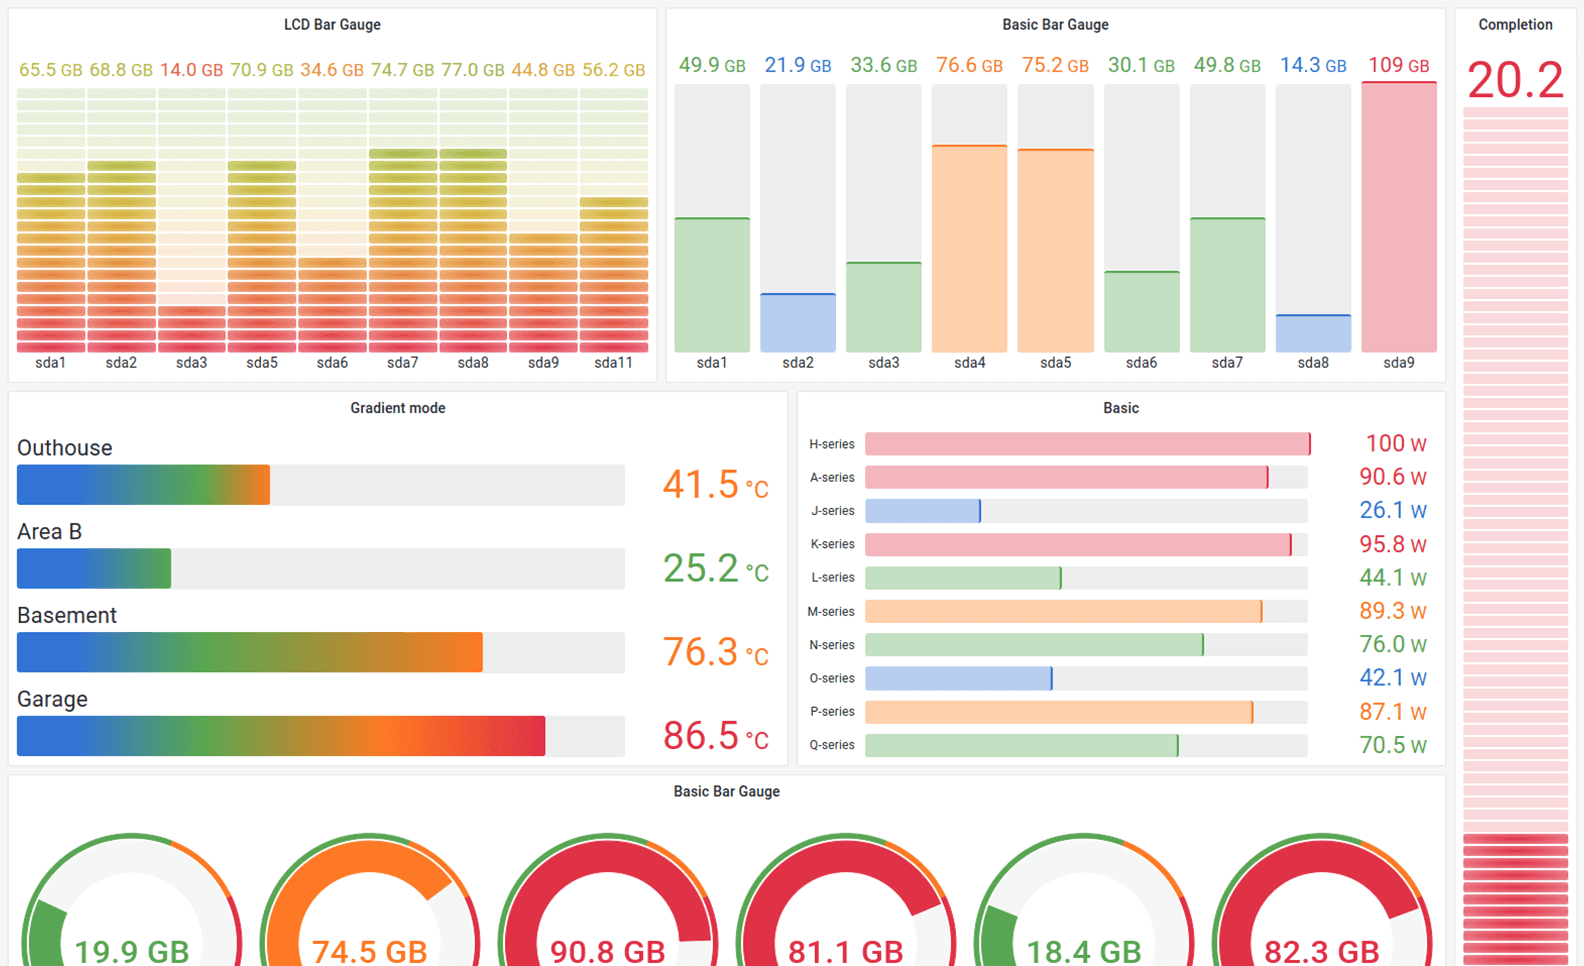
Gauge
Gauge
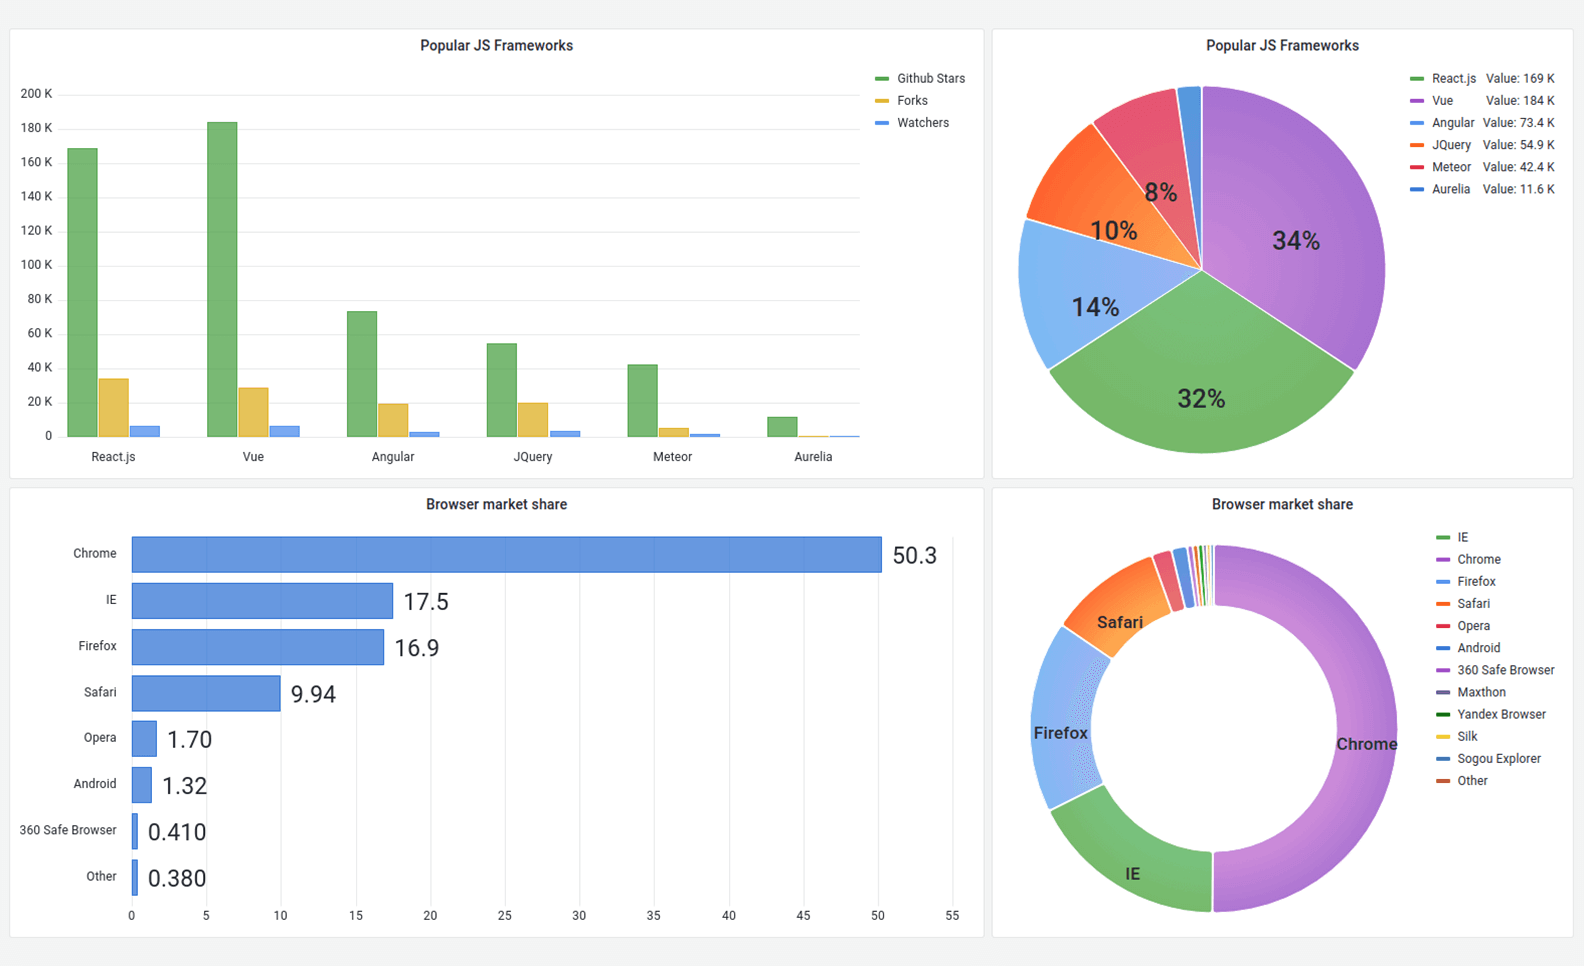
Bar chart and pie chart

Plugins

Connect your tools and your teams with Grafana plugins. Data source plugins hook into existing data sources via APIs and render the data in real time without requiring you to migrate or ingest your data.

grafana plugins logos
Grafana alerting dashboard

Alerts

With Grafana Alerting, you can create, manage, and silence all of your alerts within one simple UI— allowing you to easily consolidate and centralize all of your alerts.

Transformations

Transformations allow you to rename, summarize, combine, and perform calculations across different queries and data sources.

Play
0:42

Play
0:08

Annotations

Annotate graphs with rich events from different data sources. Hover over events shows you the full event metadata and tags.

Panel editor

The panel editor makes it easy to configure, customize and explore all of your panels with a consistent UI for setting data options across all of your visualizations.

Play
0:26

Collaborate

Effective collaboration is built on people having access to the same information. Allows you to easily share insights from Grafana dashboards across your company, team and the world.

With your team

Share insights from Grafana dashboards across your company- even if they’re not Grafana users themselves

With the world

Easily share and discover dashboards with anyone from the Grafana community

Anywhere you go

See your Grafana dashboards wherever you go, on all of your devices


Amazon logo
NOAA Logo
Sephora Logo
Citrix logo
Microsoft logo
Yum logo
GitLab logo
Carvana logo

Start building beautiful dashboards