What you'll learn
- How performance testing and observability are complementary
- How to run performance tests as code with Grafana k6
- How to correlate client-side performance test results with server-side metrics, logs and traces to debug failed tests faster
Performance Testing + Observability: Better Together
Performance testing adds a proactive dimension to observability. You generate virtual user traffic towards a pre-production version of your system and then observe the system to understand how it responds to the traffic stimuli by looking at metrics, logs, and traces. This allows you to find and fix performance problems earlier in the software development lifecycle, when it’s less costly to fix them.
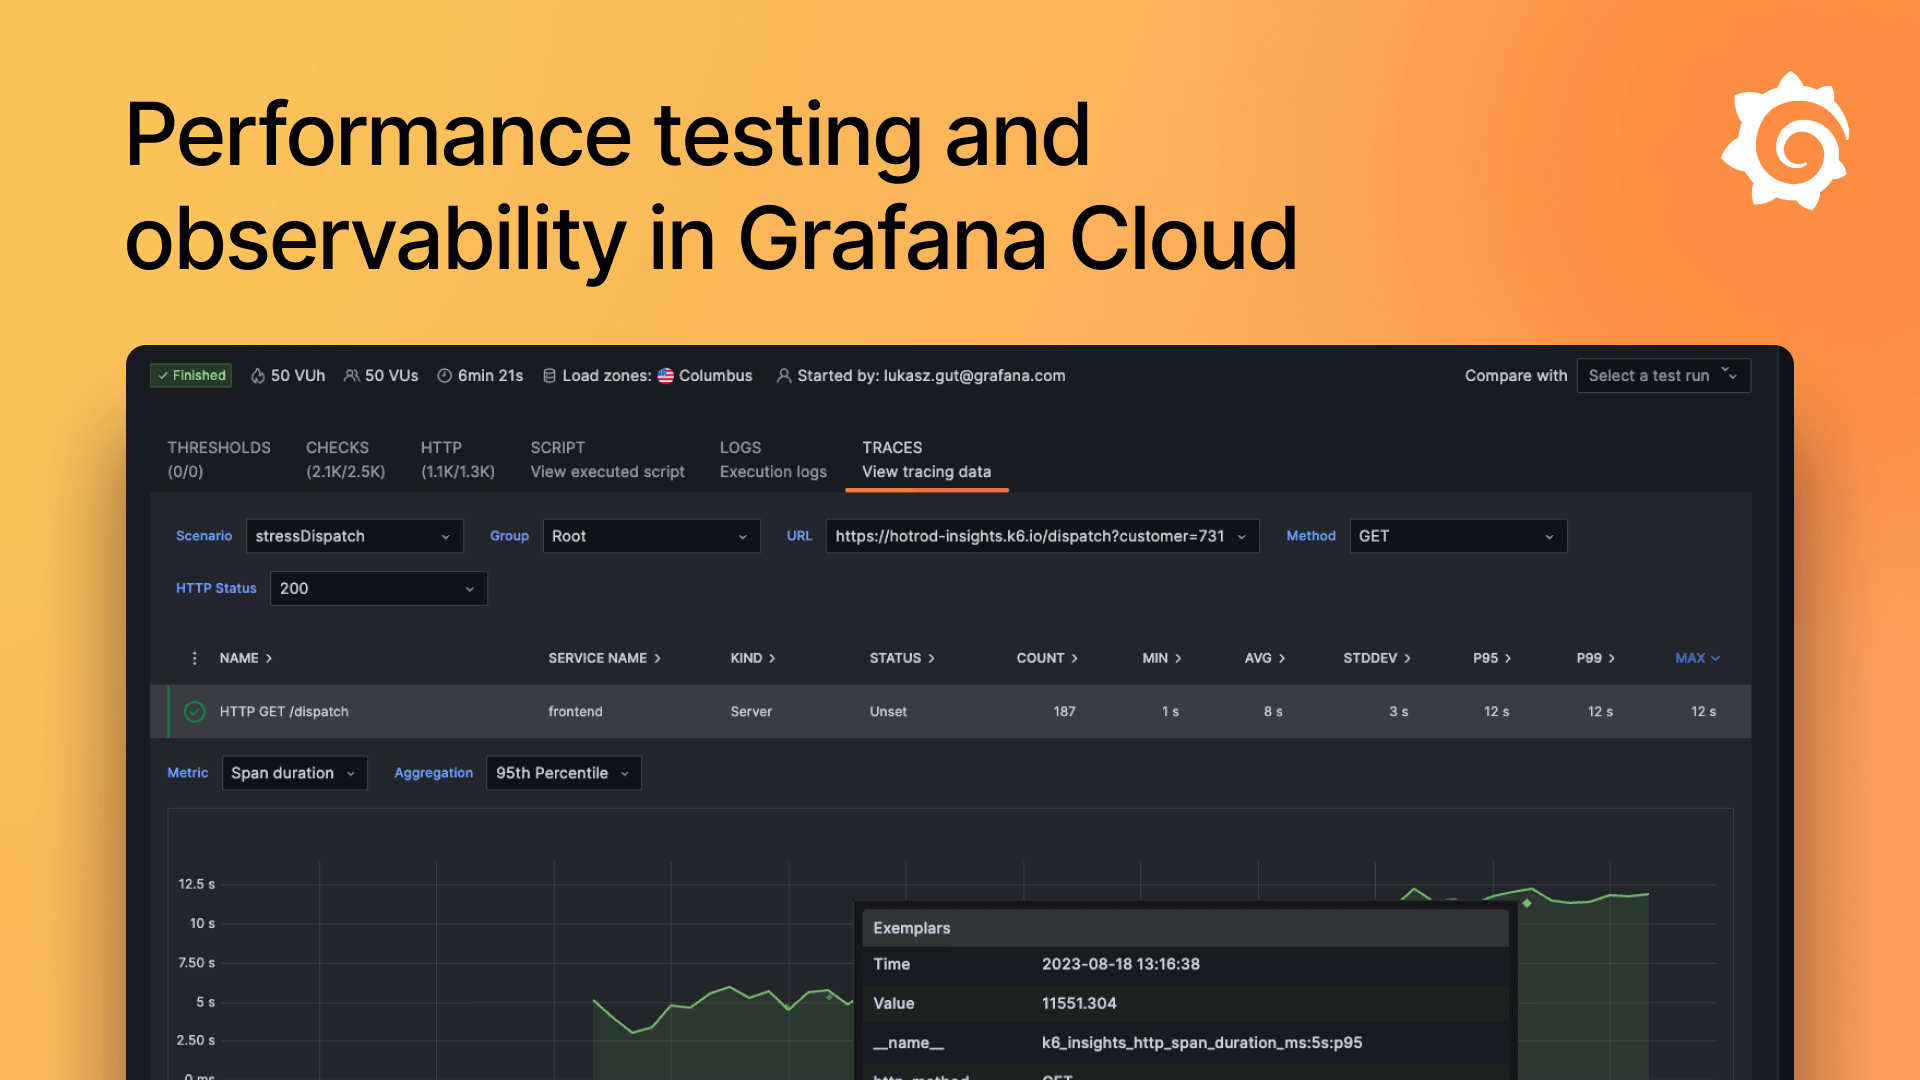
Learn how Grafana Cloud k6 offers you the best developer experience for performance testing and how its correlation with Grafana Cloud Metrics, Traces and Logs expands your visibility, allowing you to troubleshoot failed performance tests faster. We will highlight how our latest innovation - Distributed Tracing in Grafana Cloud k6 - lets you go from performance tests to root cause analysis in just a few clicks.
Your guide


