
What you'll learn
- How to see an issue using metrics
- How to look into an issue using logs
- How to further identify an issue using traces
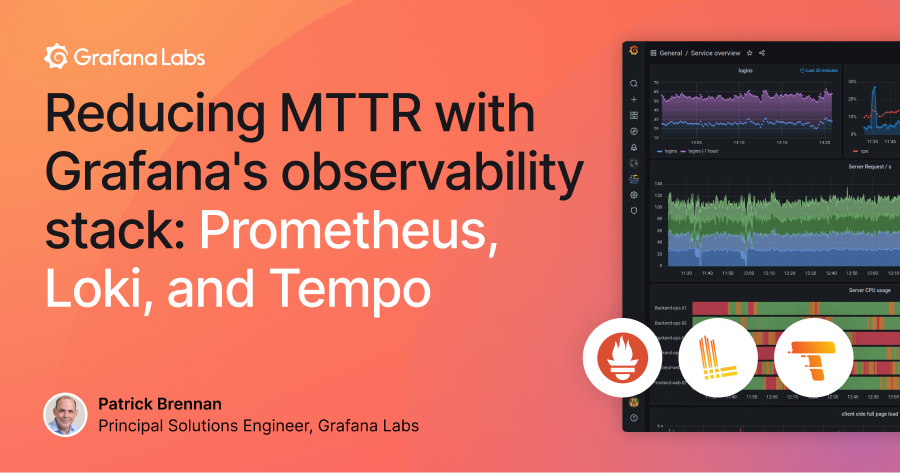
While Grafana is well-known for its interoperability with a wide range of data sources and tools, we also offer an opinionated observability stack based on Prometheus, Grafana Loki, and Grafana Tempo. This webinar will demonstrate how working with Prometheus for metrics, Loki for logs, and Tempo for traces together can help you reduce MTTR, understand what is happening in the environment, and be able to not only resolve the immediate issue, but also address the underlying issue so that it does not happen again.
We will show how, within Grafana, you can see an issue first by using metrics, and then quickly look at the logs without having to manually do anything. Finally, you can seamlessly move on to traces to further identify the issue.
Your guide

Patrick Brennan
Principal Solutions Engineer